Colville vs Immigrants from Scotland Disability
COMPARE
Colville
Immigrants from Scotland
Disability
Disability Comparison
Colville
Immigrants from Scotland
15.8%
DISABILITY
0.0/ 100
METRIC RATING
344th/ 347
METRIC RANK
11.8%
DISABILITY
28.2/ 100
METRIC RATING
186th/ 347
METRIC RANK
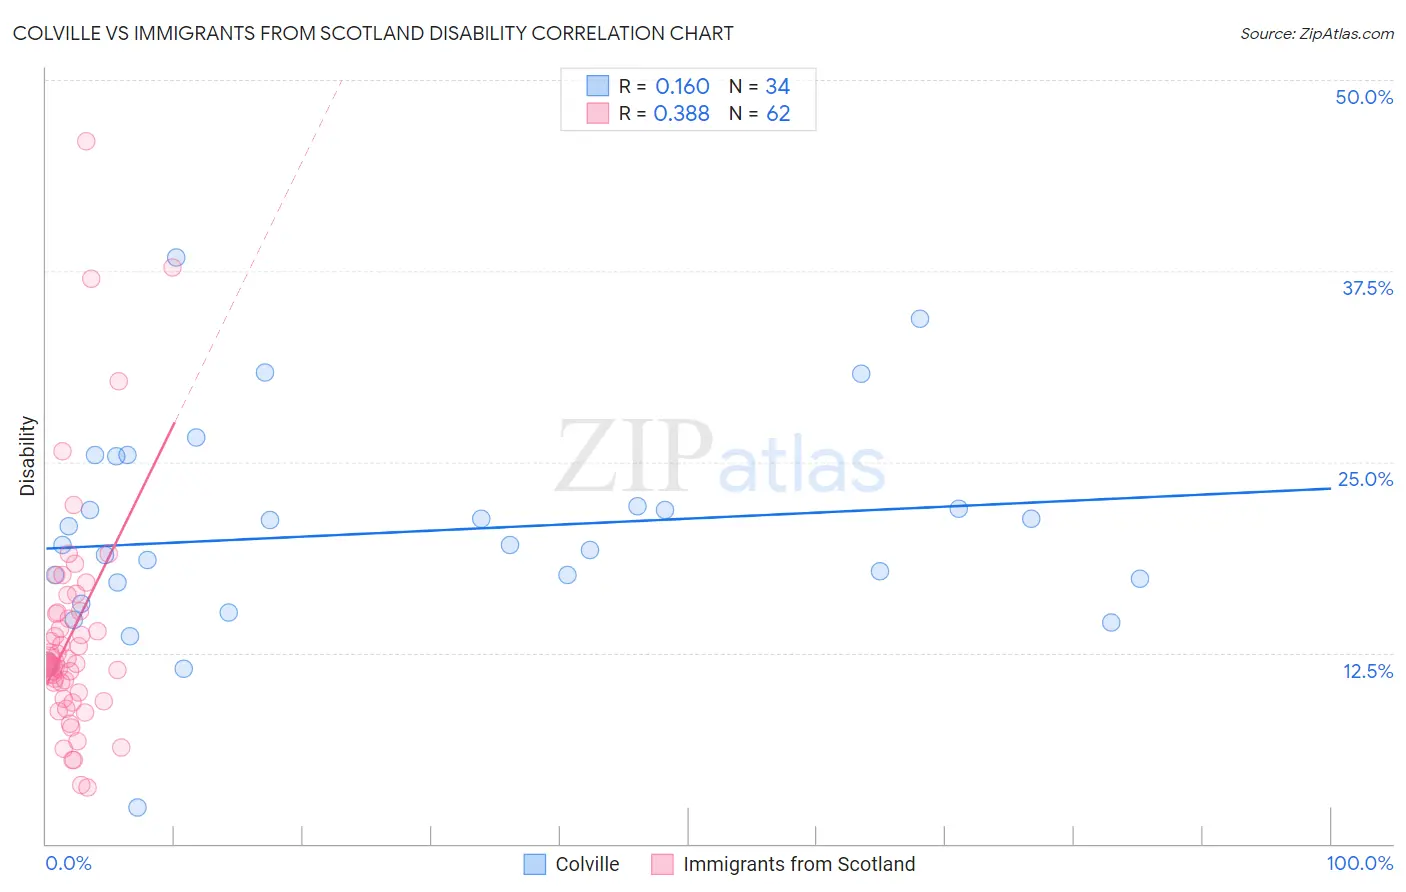
Colville vs Immigrants from Scotland Disability Correlation Chart
The statistical analysis conducted on geographies consisting of 34,687,707 people shows a poor positive correlation between the proportion of Colville and percentage of population with a disability in the United States with a correlation coefficient (R) of 0.160 and weighted average of 15.8%. Similarly, the statistical analysis conducted on geographies consisting of 196,399,037 people shows a mild positive correlation between the proportion of Immigrants from Scotland and percentage of population with a disability in the United States with a correlation coefficient (R) of 0.388 and weighted average of 11.8%, a difference of 33.6%.
Disability Correlation Summary
| Measurement | Colville | Immigrants from Scotland |
| Minimum | 2.4% | 3.7% |
| Maximum | 38.4% | 46.0% |
| Range | 36.0% | 42.3% |
| Mean | 20.4% | 13.8% |
| Median | 19.6% | 11.8% |
| Interquartile 25% (IQ1) | 17.1% | 9.9% |
| Interquartile 75% (IQ3) | 22.1% | 15.1% |
| Interquartile Range (IQR) | 5.0% | 5.2% |
| Standard Deviation (Sample) | 6.9% | 7.7% |
| Standard Deviation (Population) | 6.8% | 7.6% |
Similar Demographics by Disability
Demographics Similar to Colville by Disability
In terms of disability, the demographic groups most similar to Colville are Creek (15.6%, a difference of 1.2%), Kiowa (15.6%, a difference of 1.2%), Lumbee (15.5%, a difference of 1.7%), Puerto Rican (16.1%, a difference of 2.0%), and Tsimshian (16.1%, a difference of 2.2%).
| Demographics | Rating | Rank | Disability |
| Cajuns | 0.0 /100 | #333 | Tragic 14.6% |
| Yuman | 0.0 /100 | #334 | Tragic 14.6% |
| Tohono O'odham | 0.0 /100 | #335 | Tragic 14.8% |
| Cherokee | 0.0 /100 | #336 | Tragic 14.8% |
| Seminole | 0.0 /100 | #337 | Tragic 14.9% |
| Dutch West Indians | 0.0 /100 | #338 | Tragic 14.9% |
| Chickasaw | 0.0 /100 | #339 | Tragic 15.2% |
| Choctaw | 0.0 /100 | #340 | Tragic 15.4% |
| Lumbee | 0.0 /100 | #341 | Tragic 15.5% |
| Kiowa | 0.0 /100 | #342 | Tragic 15.6% |
| Creek | 0.0 /100 | #343 | Tragic 15.6% |
| Colville | 0.0 /100 | #344 | Tragic 15.8% |
| Puerto Ricans | 0.0 /100 | #345 | Tragic 16.1% |
| Tsimshian | 0.0 /100 | #346 | Tragic 16.1% |
| Houma | 0.0 /100 | #347 | Tragic 17.1% |
Demographics Similar to Immigrants from Scotland by Disability
In terms of disability, the demographic groups most similar to Immigrants from Scotland are Immigrants from Burma/Myanmar (11.8%, a difference of 0.010%), Lebanese (11.8%, a difference of 0.020%), Iraqi (11.8%, a difference of 0.090%), Honduran (11.8%, a difference of 0.16%), and Immigrants from Mexico (11.9%, a difference of 0.26%).
| Demographics | Rating | Rank | Disability |
| Immigrants | Armenia | 41.9 /100 | #179 | Average 11.7% |
| Immigrants | Honduras | 37.8 /100 | #180 | Fair 11.8% |
| Immigrants | Oceania | 34.3 /100 | #181 | Fair 11.8% |
| Icelanders | 34.0 /100 | #182 | Fair 11.8% |
| Hondurans | 31.2 /100 | #183 | Fair 11.8% |
| Iraqis | 30.0 /100 | #184 | Fair 11.8% |
| Immigrants | Burma/Myanmar | 28.5 /100 | #185 | Fair 11.8% |
| Immigrants | Scotland | 28.2 /100 | #186 | Fair 11.8% |
| Lebanese | 27.9 /100 | #187 | Fair 11.8% |
| Immigrants | Mexico | 23.8 /100 | #188 | Fair 11.9% |
| Immigrants | Zaire | 21.8 /100 | #189 | Fair 11.9% |
| Immigrants | West Indies | 21.1 /100 | #190 | Fair 11.9% |
| Ute | 19.5 /100 | #191 | Poor 11.9% |
| Lithuanians | 18.8 /100 | #192 | Poor 11.9% |
| Immigrants | Bosnia and Herzegovina | 18.0 /100 | #193 | Poor 11.9% |