Chickasaw vs Immigrants from Burma/Myanmar Vision Disability
COMPARE
Chickasaw
Immigrants from Burma/Myanmar
Vision Disability
Vision Disability Comparison
Chickasaw
Immigrants from Burma/Myanmar
3.2%
VISION DISABILITY
0.0/ 100
METRIC RATING
338th/ 347
METRIC RANK
2.2%
VISION DISABILITY
37.9/ 100
METRIC RATING
183rd/ 347
METRIC RANK
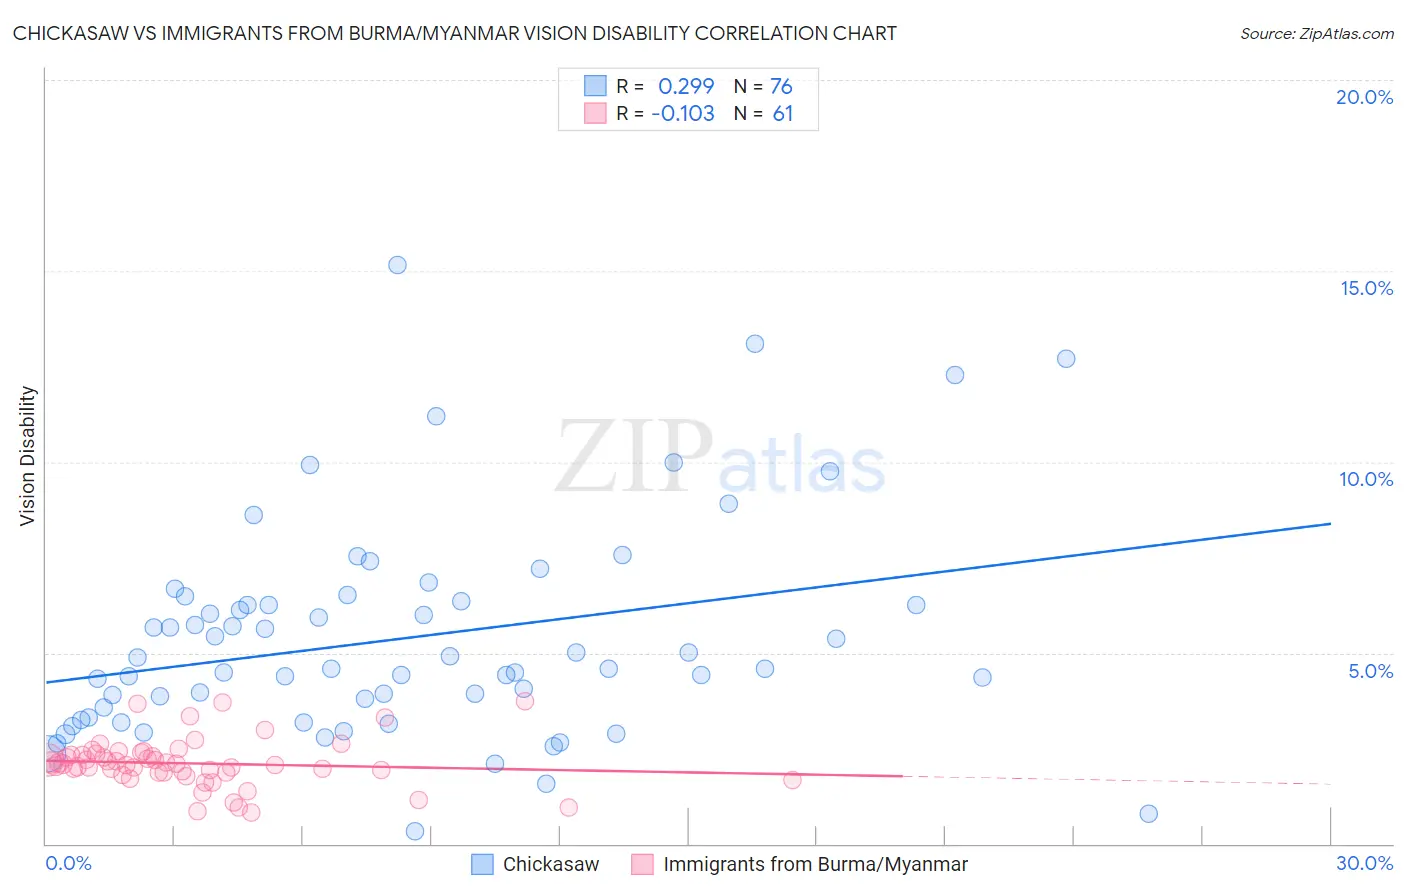
Chickasaw vs Immigrants from Burma/Myanmar Vision Disability Correlation Chart
The statistical analysis conducted on geographies consisting of 147,658,152 people shows a weak positive correlation between the proportion of Chickasaw and percentage of population with vision disability in the United States with a correlation coefficient (R) of 0.299 and weighted average of 3.2%. Similarly, the statistical analysis conducted on geographies consisting of 172,315,861 people shows a poor negative correlation between the proportion of Immigrants from Burma/Myanmar and percentage of population with vision disability in the United States with a correlation coefficient (R) of -0.103 and weighted average of 2.2%, a difference of 45.6%.
Vision Disability Correlation Summary
| Measurement | Chickasaw | Immigrants from Burma/Myanmar |
| Minimum | 0.33% | 0.83% |
| Maximum | 15.2% | 3.7% |
| Range | 14.8% | 2.9% |
| Mean | 5.4% | 2.1% |
| Median | 4.6% | 2.1% |
| Interquartile 25% (IQ1) | 3.5% | 1.9% |
| Interquartile 75% (IQ3) | 6.3% | 2.3% |
| Interquartile Range (IQR) | 2.9% | 0.47% |
| Standard Deviation (Sample) | 2.8% | 0.62% |
| Standard Deviation (Population) | 2.8% | 0.62% |
Similar Demographics by Vision Disability
Demographics Similar to Chickasaw by Vision Disability
In terms of vision disability, the demographic groups most similar to Chickasaw are Tsimshian (3.2%, a difference of 0.69%), Creek (3.2%, a difference of 0.82%), Dutch West Indian (3.2%, a difference of 0.91%), Alaskan Athabascan (3.1%, a difference of 0.93%), and Navajo (3.1%, a difference of 1.1%).
| Demographics | Rating | Rank | Vision Disability |
| Central American Indians | 0.0 /100 | #331 | Tragic 3.0% |
| Seminole | 0.0 /100 | #332 | Tragic 3.1% |
| Cajuns | 0.0 /100 | #333 | Tragic 3.1% |
| Cheyenne | 0.0 /100 | #334 | Tragic 3.1% |
| Navajo | 0.0 /100 | #335 | Tragic 3.1% |
| Alaskan Athabascans | 0.0 /100 | #336 | Tragic 3.1% |
| Dutch West Indians | 0.0 /100 | #337 | Tragic 3.2% |
| Chickasaw | 0.0 /100 | #338 | Tragic 3.2% |
| Tsimshian | 0.0 /100 | #339 | Tragic 3.2% |
| Creek | 0.0 /100 | #340 | Tragic 3.2% |
| Kiowa | 0.0 /100 | #341 | Tragic 3.3% |
| Choctaw | 0.0 /100 | #342 | Tragic 3.3% |
| Pima | 0.0 /100 | #343 | Tragic 3.3% |
| Pueblo | 0.0 /100 | #344 | Tragic 3.3% |
| Lumbee | 0.0 /100 | #345 | Tragic 3.4% |
Demographics Similar to Immigrants from Burma/Myanmar by Vision Disability
In terms of vision disability, the demographic groups most similar to Immigrants from Burma/Myanmar are Moroccan (2.2%, a difference of 0.17%), Costa Rican (2.2%, a difference of 0.19%), Immigrants from Western Europe (2.2%, a difference of 0.21%), Immigrants from Middle Africa (2.2%, a difference of 0.30%), and Uruguayan (2.2%, a difference of 0.31%).
| Demographics | Rating | Rank | Vision Disability |
| Yugoslavians | 46.5 /100 | #176 | Average 2.2% |
| Slavs | 46.0 /100 | #177 | Average 2.2% |
| Immigrants | Oceania | 45.1 /100 | #178 | Average 2.2% |
| Immigrants | North America | 44.5 /100 | #179 | Average 2.2% |
| Uruguayans | 42.7 /100 | #180 | Average 2.2% |
| Immigrants | Western Europe | 41.1 /100 | #181 | Average 2.2% |
| Costa Ricans | 40.7 /100 | #182 | Average 2.2% |
| Immigrants | Burma/Myanmar | 37.9 /100 | #183 | Fair 2.2% |
| Moroccans | 35.4 /100 | #184 | Fair 2.2% |
| Immigrants | Middle Africa | 33.5 /100 | #185 | Fair 2.2% |
| Native Hawaiians | 33.3 /100 | #186 | Fair 2.2% |
| Immigrants | St. Vincent and the Grenadines | 30.3 /100 | #187 | Fair 2.2% |
| Guyanese | 28.9 /100 | #188 | Fair 2.2% |
| Salvadorans | 27.4 /100 | #189 | Fair 2.2% |
| Immigrants | Costa Rica | 26.1 /100 | #190 | Fair 2.2% |