Senegalese vs Immigrants from Burma/Myanmar Vision Disability
COMPARE
Senegalese
Immigrants from Burma/Myanmar
Vision Disability
Vision Disability Comparison
Senegalese
Immigrants from Burma/Myanmar
2.4%
VISION DISABILITY
0.1/ 100
METRIC RATING
268th/ 347
METRIC RANK
2.2%
VISION DISABILITY
37.9/ 100
METRIC RATING
183rd/ 347
METRIC RANK
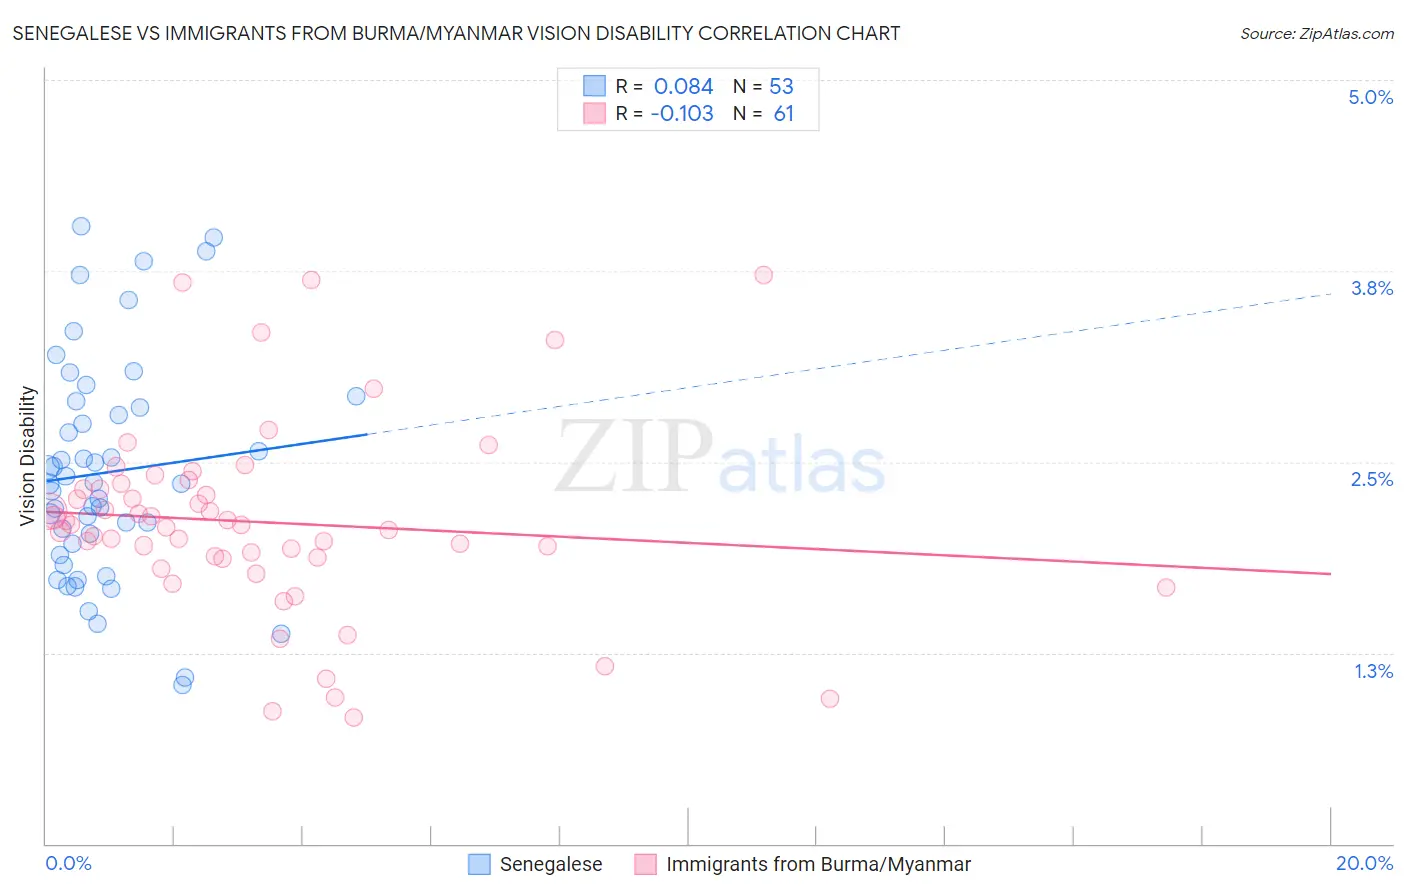
Senegalese vs Immigrants from Burma/Myanmar Vision Disability Correlation Chart
The statistical analysis conducted on geographies consisting of 78,129,878 people shows a slight positive correlation between the proportion of Senegalese and percentage of population with vision disability in the United States with a correlation coefficient (R) of 0.084 and weighted average of 2.4%. Similarly, the statistical analysis conducted on geographies consisting of 172,315,861 people shows a poor negative correlation between the proportion of Immigrants from Burma/Myanmar and percentage of population with vision disability in the United States with a correlation coefficient (R) of -0.103 and weighted average of 2.2%, a difference of 10.0%.
Vision Disability Correlation Summary
| Measurement | Senegalese | Immigrants from Burma/Myanmar |
| Minimum | 1.0% | 0.83% |
| Maximum | 4.0% | 3.7% |
| Range | 3.0% | 2.9% |
| Mean | 2.4% | 2.1% |
| Median | 2.4% | 2.1% |
| Interquartile 25% (IQ1) | 1.9% | 1.9% |
| Interquartile 75% (IQ3) | 2.9% | 2.3% |
| Interquartile Range (IQR) | 0.95% | 0.47% |
| Standard Deviation (Sample) | 0.72% | 0.62% |
| Standard Deviation (Population) | 0.72% | 0.62% |
Similar Demographics by Vision Disability
Demographics Similar to Senegalese by Vision Disability
In terms of vision disability, the demographic groups most similar to Senegalese are Ute (2.4%, a difference of 0.090%), Mexican American Indian (2.4%, a difference of 0.10%), Immigrants from Jamaica (2.4%, a difference of 0.14%), Immigrants from Liberia (2.4%, a difference of 0.16%), and Celtic (2.4%, a difference of 0.27%).
| Demographics | Rating | Rank | Vision Disability |
| Fijians | 0.1 /100 | #261 | Tragic 2.4% |
| Jamaicans | 0.1 /100 | #262 | Tragic 2.4% |
| Immigrants | Belize | 0.1 /100 | #263 | Tragic 2.4% |
| Immigrants | Liberia | 0.1 /100 | #264 | Tragic 2.4% |
| Immigrants | Jamaica | 0.1 /100 | #265 | Tragic 2.4% |
| Mexican American Indians | 0.1 /100 | #266 | Tragic 2.4% |
| Ute | 0.1 /100 | #267 | Tragic 2.4% |
| Senegalese | 0.1 /100 | #268 | Tragic 2.4% |
| Celtics | 0.1 /100 | #269 | Tragic 2.4% |
| Cubans | 0.1 /100 | #270 | Tragic 2.4% |
| Immigrants | Azores | 0.1 /100 | #271 | Tragic 2.4% |
| Spaniards | 0.1 /100 | #272 | Tragic 2.4% |
| Immigrants | Bahamas | 0.1 /100 | #273 | Tragic 2.4% |
| Immigrants | Latin America | 0.0 /100 | #274 | Tragic 2.4% |
| Chippewa | 0.0 /100 | #275 | Tragic 2.4% |
Demographics Similar to Immigrants from Burma/Myanmar by Vision Disability
In terms of vision disability, the demographic groups most similar to Immigrants from Burma/Myanmar are Moroccan (2.2%, a difference of 0.17%), Costa Rican (2.2%, a difference of 0.19%), Immigrants from Western Europe (2.2%, a difference of 0.21%), Immigrants from Middle Africa (2.2%, a difference of 0.30%), and Uruguayan (2.2%, a difference of 0.31%).
| Demographics | Rating | Rank | Vision Disability |
| Yugoslavians | 46.5 /100 | #176 | Average 2.2% |
| Slavs | 46.0 /100 | #177 | Average 2.2% |
| Immigrants | Oceania | 45.1 /100 | #178 | Average 2.2% |
| Immigrants | North America | 44.5 /100 | #179 | Average 2.2% |
| Uruguayans | 42.7 /100 | #180 | Average 2.2% |
| Immigrants | Western Europe | 41.1 /100 | #181 | Average 2.2% |
| Costa Ricans | 40.7 /100 | #182 | Average 2.2% |
| Immigrants | Burma/Myanmar | 37.9 /100 | #183 | Fair 2.2% |
| Moroccans | 35.4 /100 | #184 | Fair 2.2% |
| Immigrants | Middle Africa | 33.5 /100 | #185 | Fair 2.2% |
| Native Hawaiians | 33.3 /100 | #186 | Fair 2.2% |
| Immigrants | St. Vincent and the Grenadines | 30.3 /100 | #187 | Fair 2.2% |
| Guyanese | 28.9 /100 | #188 | Fair 2.2% |
| Salvadorans | 27.4 /100 | #189 | Fair 2.2% |
| Immigrants | Costa Rica | 26.1 /100 | #190 | Fair 2.2% |