Chinese vs Immigrants from Burma/Myanmar Unemployment Among Ages 20 to 24 years
COMPARE
Chinese
Immigrants from Burma/Myanmar
Unemployment Among Ages 20 to 24 years
Unemployment Among Ages 20 to 24 years Comparison
Chinese
Immigrants from Burma/Myanmar
9.4%
UNEMPLOYMENT AMONG AGES 20 TO 24 YEARS
100.0/ 100
METRIC RATING
18th/ 347
METRIC RANK
9.1%
UNEMPLOYMENT AMONG AGES 20 TO 24 YEARS
100.0/ 100
METRIC RATING
6th/ 347
METRIC RANK
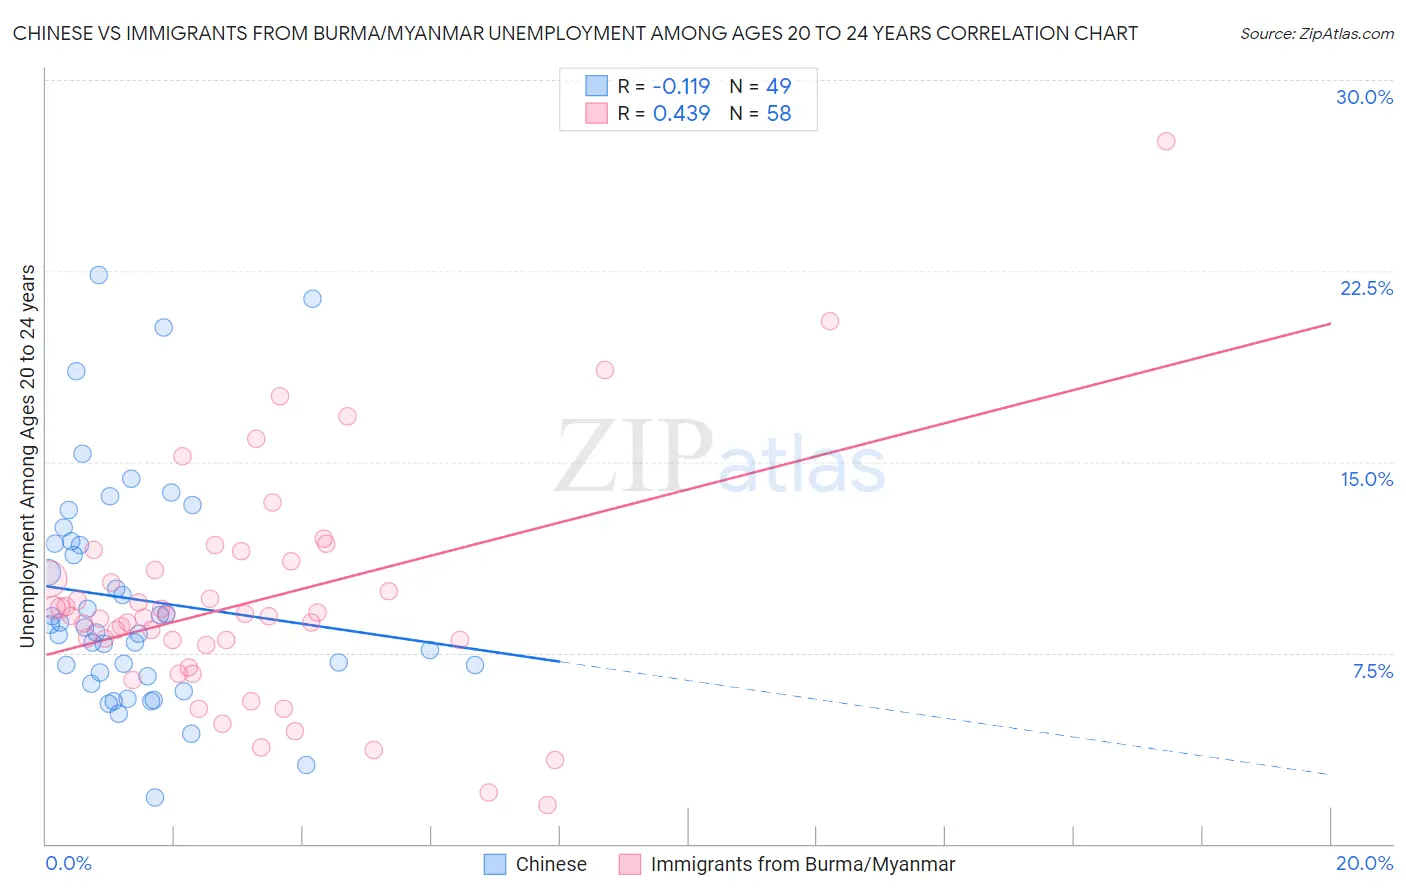
Chinese vs Immigrants from Burma/Myanmar Unemployment Among Ages 20 to 24 years Correlation Chart
The statistical analysis conducted on geographies consisting of 64,258,935 people shows a poor negative correlation between the proportion of Chinese and unemployment rate among population between the ages 20 and 24 in the United States with a correlation coefficient (R) of -0.119 and weighted average of 9.4%. Similarly, the statistical analysis conducted on geographies consisting of 170,830,941 people shows a moderate positive correlation between the proportion of Immigrants from Burma/Myanmar and unemployment rate among population between the ages 20 and 24 in the United States with a correlation coefficient (R) of 0.439 and weighted average of 9.1%, a difference of 3.1%.
Unemployment Among Ages 20 to 24 years Correlation Summary
| Measurement | Chinese | Immigrants from Burma/Myanmar |
| Minimum | 1.8% | 1.5% |
| Maximum | 22.3% | 27.6% |
| Range | 20.5% | 26.1% |
| Mean | 9.6% | 9.5% |
| Median | 8.5% | 8.9% |
| Interquartile 25% (IQ1) | 6.7% | 7.8% |
| Interquartile 75% (IQ3) | 11.8% | 10.8% |
| Interquartile Range (IQR) | 5.2% | 3.0% |
| Standard Deviation (Sample) | 4.5% | 4.5% |
| Standard Deviation (Population) | 4.4% | 4.4% |
Demographics Similar to Chinese and Immigrants from Burma/Myanmar by Unemployment Among Ages 20 to 24 years
In terms of unemployment among ages 20 to 24 years, the demographic groups most similar to Chinese are Hmong (9.4%, a difference of 0.12%), Osage (9.4%, a difference of 0.13%), Immigrants from Bosnia and Herzegovina (9.4%, a difference of 0.13%), Tongan (9.4%, a difference of 0.40%), and Czech (9.3%, a difference of 0.44%). Similarly, the demographic groups most similar to Immigrants from Burma/Myanmar are Luxembourger (9.1%, a difference of 0.36%), Somali (9.1%, a difference of 0.38%), Norwegian (9.0%, a difference of 0.60%), Immigrants from Somalia (9.2%, a difference of 0.73%), and Venezuelan (9.0%, a difference of 0.82%).
| Demographics | Rating | Rank | Unemployment Among Ages 20 to 24 years |
| Immigrants | Venezuela | 100.0 /100 | #2 | Exceptional 8.9% |
| Indonesians | 100.0 /100 | #3 | Exceptional 9.0% |
| Venezuelans | 100.0 /100 | #4 | Exceptional 9.0% |
| Norwegians | 100.0 /100 | #5 | Exceptional 9.0% |
| Immigrants | Burma/Myanmar | 100.0 /100 | #6 | Exceptional 9.1% |
| Luxembourgers | 100.0 /100 | #7 | Exceptional 9.1% |
| Somalis | 100.0 /100 | #8 | Exceptional 9.1% |
| Immigrants | Somalia | 100.0 /100 | #9 | Exceptional 9.2% |
| Sudanese | 100.0 /100 | #10 | Exceptional 9.2% |
| Zimbabweans | 100.0 /100 | #11 | Exceptional 9.2% |
| Cubans | 100.0 /100 | #12 | Exceptional 9.2% |
| Immigrants | Congo | 100.0 /100 | #13 | Exceptional 9.2% |
| Slovenes | 100.0 /100 | #14 | Exceptional 9.3% |
| Immigrants | Sudan | 100.0 /100 | #15 | Exceptional 9.3% |
| Danes | 100.0 /100 | #16 | Exceptional 9.3% |
| Czechs | 100.0 /100 | #17 | Exceptional 9.3% |
| Chinese | 100.0 /100 | #18 | Exceptional 9.4% |
| Hmong | 100.0 /100 | #19 | Exceptional 9.4% |
| Osage | 100.0 /100 | #20 | Exceptional 9.4% |
| Immigrants | Bosnia and Herzegovina | 100.0 /100 | #21 | Exceptional 9.4% |
| Tongans | 100.0 /100 | #22 | Exceptional 9.4% |