Russian vs Immigrants from Afghanistan Hearing Disability
COMPARE
Russian
Immigrants from Afghanistan
Hearing Disability
Hearing Disability Comparison
Russians
Immigrants from Afghanistan
3.2%
HEARING DISABILITY
7.1/ 100
METRIC RATING
217th/ 347
METRIC RANK
2.8%
HEARING DISABILITY
95.3/ 100
METRIC RATING
97th/ 347
METRIC RANK
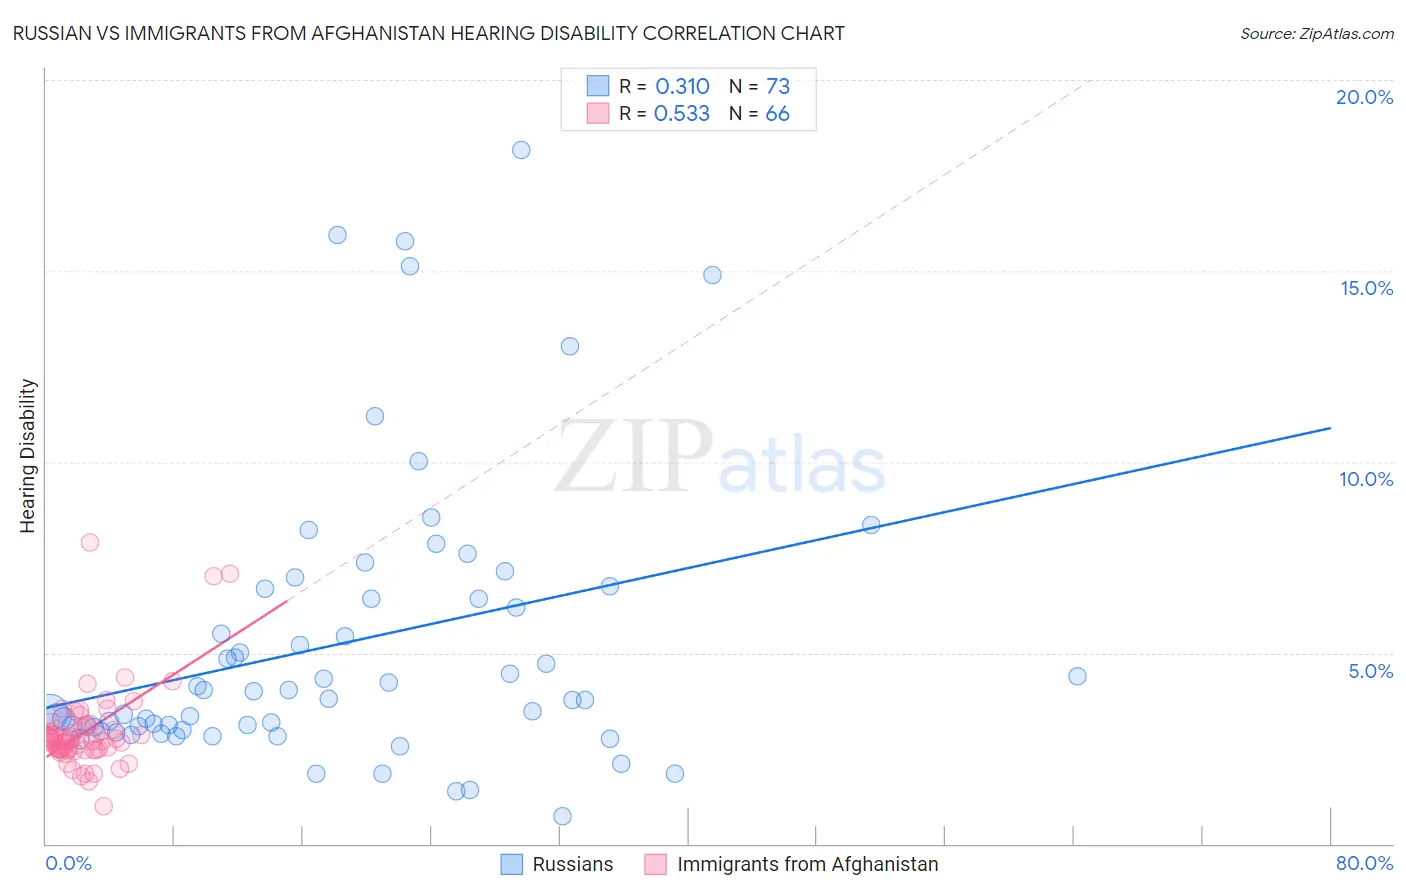
Russian vs Immigrants from Afghanistan Hearing Disability Correlation Chart
The statistical analysis conducted on geographies consisting of 511,868,935 people shows a mild positive correlation between the proportion of Russians and percentage of population with hearing disability in the United States with a correlation coefficient (R) of 0.310 and weighted average of 3.2%. Similarly, the statistical analysis conducted on geographies consisting of 147,605,800 people shows a substantial positive correlation between the proportion of Immigrants from Afghanistan and percentage of population with hearing disability in the United States with a correlation coefficient (R) of 0.533 and weighted average of 2.8%, a difference of 14.1%.
Hearing Disability Correlation Summary
| Measurement | Russian | Immigrants from Afghanistan |
| Minimum | 0.73% | 0.97% |
| Maximum | 18.2% | 7.9% |
| Range | 17.5% | 6.9% |
| Mean | 5.2% | 2.9% |
| Median | 3.8% | 2.7% |
| Interquartile 25% (IQ1) | 3.0% | 2.5% |
| Interquartile 75% (IQ3) | 6.5% | 3.0% |
| Interquartile Range (IQR) | 3.5% | 0.57% |
| Standard Deviation (Sample) | 3.7% | 1.1% |
| Standard Deviation (Population) | 3.7% | 1.1% |
Similar Demographics by Hearing Disability
Demographics Similar to Russians by Hearing Disability
In terms of hearing disability, the demographic groups most similar to Russians are Immigrants from Northern Europe (3.2%, a difference of 0.040%), Immigrants from Norway (3.2%, a difference of 0.080%), New Zealander (3.2%, a difference of 0.10%), Malaysian (3.2%, a difference of 0.16%), and Immigrants from Laos (3.2%, a difference of 0.16%).
| Demographics | Rating | Rank | Hearing Disability |
| Cape Verdeans | 12.2 /100 | #210 | Poor 3.1% |
| Romanians | 12.1 /100 | #211 | Poor 3.1% |
| Pakistanis | 11.1 /100 | #212 | Poor 3.1% |
| Immigrants | Iraq | 10.5 /100 | #213 | Poor 3.1% |
| Australians | 8.1 /100 | #214 | Tragic 3.2% |
| Bangladeshis | 8.1 /100 | #215 | Tragic 3.2% |
| Immigrants | Norway | 7.3 /100 | #216 | Tragic 3.2% |
| Russians | 7.1 /100 | #217 | Tragic 3.2% |
| Immigrants | Northern Europe | 7.0 /100 | #218 | Tragic 3.2% |
| New Zealanders | 6.8 /100 | #219 | Tragic 3.2% |
| Malaysians | 6.6 /100 | #220 | Tragic 3.2% |
| Immigrants | Laos | 6.6 /100 | #221 | Tragic 3.2% |
| Immigrants | Oceania | 6.5 /100 | #222 | Tragic 3.2% |
| Mexicans | 5.6 /100 | #223 | Tragic 3.2% |
| Icelanders | 5.2 /100 | #224 | Tragic 3.2% |
Demographics Similar to Immigrants from Afghanistan by Hearing Disability
In terms of hearing disability, the demographic groups most similar to Immigrants from Afghanistan are Immigrants from Honduras (2.8%, a difference of 0.060%), Immigrants from Guatemala (2.8%, a difference of 0.10%), Immigrants from Eastern Africa (2.8%, a difference of 0.15%), Immigrants from Somalia (2.8%, a difference of 0.17%), and Immigrants from Spain (2.8%, a difference of 0.21%).
| Demographics | Rating | Rank | Hearing Disability |
| Immigrants | Morocco | 96.6 /100 | #90 | Exceptional 2.8% |
| Immigrants | Middle Africa | 96.5 /100 | #91 | Exceptional 2.8% |
| Iranians | 96.4 /100 | #92 | Exceptional 2.8% |
| Immigrants | Kuwait | 96.3 /100 | #93 | Exceptional 2.8% |
| Uruguayans | 95.9 /100 | #94 | Exceptional 2.8% |
| Israelis | 95.9 /100 | #95 | Exceptional 2.8% |
| Immigrants | Somalia | 95.5 /100 | #96 | Exceptional 2.8% |
| Immigrants | Afghanistan | 95.3 /100 | #97 | Exceptional 2.8% |
| Immigrants | Honduras | 95.1 /100 | #98 | Exceptional 2.8% |
| Immigrants | Guatemala | 95.1 /100 | #99 | Exceptional 2.8% |
| Immigrants | Eastern Africa | 95.0 /100 | #100 | Exceptional 2.8% |
| Immigrants | Spain | 94.9 /100 | #101 | Exceptional 2.8% |
| Taiwanese | 94.8 /100 | #102 | Exceptional 2.8% |
| Immigrants | Indonesia | 94.7 /100 | #103 | Exceptional 2.8% |
| Burmese | 94.2 /100 | #104 | Exceptional 2.8% |