Paraguayan vs Immigrants from Afghanistan Hearing Disability
COMPARE
Paraguayan
Immigrants from Afghanistan
Hearing Disability
Hearing Disability Comparison
Paraguayans
Immigrants from Afghanistan
2.7%
HEARING DISABILITY
99.2/ 100
METRIC RATING
50th/ 347
METRIC RANK
2.8%
HEARING DISABILITY
95.3/ 100
METRIC RATING
97th/ 347
METRIC RANK
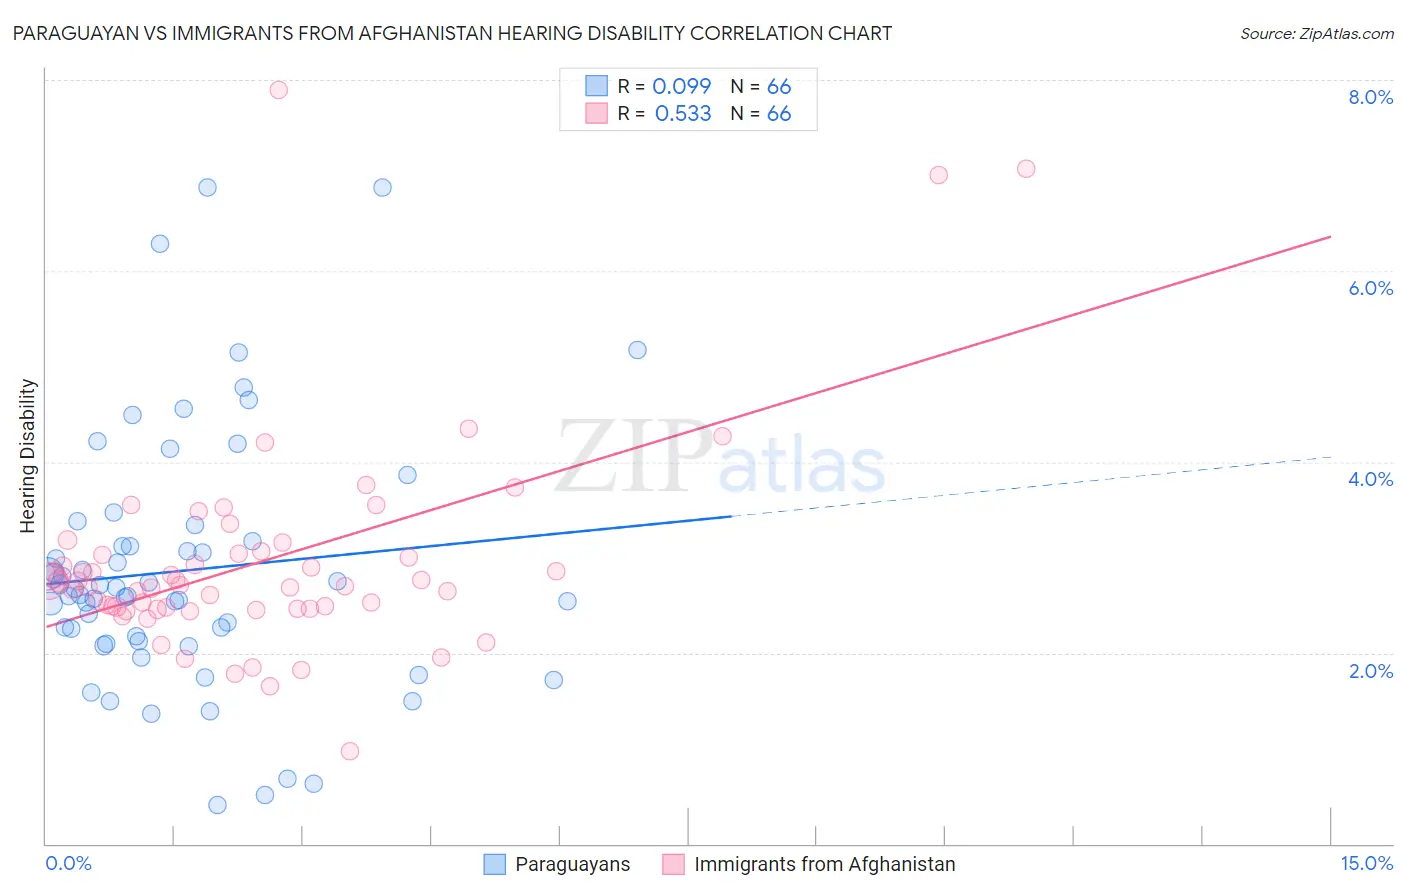
Paraguayan vs Immigrants from Afghanistan Hearing Disability Correlation Chart
The statistical analysis conducted on geographies consisting of 95,101,593 people shows a slight positive correlation between the proportion of Paraguayans and percentage of population with hearing disability in the United States with a correlation coefficient (R) of 0.099 and weighted average of 2.7%. Similarly, the statistical analysis conducted on geographies consisting of 147,605,800 people shows a substantial positive correlation between the proportion of Immigrants from Afghanistan and percentage of population with hearing disability in the United States with a correlation coefficient (R) of 0.533 and weighted average of 2.8%, a difference of 4.7%.
Hearing Disability Correlation Summary
| Measurement | Paraguayan | Immigrants from Afghanistan |
| Minimum | 0.40% | 0.97% |
| Maximum | 6.9% | 7.9% |
| Range | 6.5% | 6.9% |
| Mean | 2.9% | 2.9% |
| Median | 2.6% | 2.7% |
| Interquartile 25% (IQ1) | 2.1% | 2.5% |
| Interquartile 75% (IQ3) | 3.2% | 3.0% |
| Interquartile Range (IQR) | 1.0% | 0.57% |
| Standard Deviation (Sample) | 1.3% | 1.1% |
| Standard Deviation (Population) | 1.3% | 1.1% |
Similar Demographics by Hearing Disability
Demographics Similar to Paraguayans by Hearing Disability
In terms of hearing disability, the demographic groups most similar to Paraguayans are Immigrants from Hong Kong (2.7%, a difference of 0.070%), Immigrants from South America (2.7%, a difference of 0.19%), Immigrants from Singapore (2.6%, a difference of 0.31%), Immigrants from Israel (2.6%, a difference of 0.38%), and Jamaican (2.7%, a difference of 0.42%).
| Demographics | Rating | Rank | Hearing Disability |
| Senegalese | 99.4 /100 | #43 | Exceptional 2.6% |
| Nigerians | 99.4 /100 | #44 | Exceptional 2.6% |
| Venezuelans | 99.4 /100 | #45 | Exceptional 2.6% |
| Immigrants | Dominica | 99.3 /100 | #46 | Exceptional 2.6% |
| Immigrants | Israel | 99.3 /100 | #47 | Exceptional 2.6% |
| Immigrants | Singapore | 99.3 /100 | #48 | Exceptional 2.6% |
| Immigrants | South America | 99.2 /100 | #49 | Exceptional 2.7% |
| Paraguayans | 99.2 /100 | #50 | Exceptional 2.7% |
| Immigrants | Hong Kong | 99.2 /100 | #51 | Exceptional 2.7% |
| Jamaicans | 99.0 /100 | #52 | Exceptional 2.7% |
| Immigrants | Eastern Asia | 99.0 /100 | #53 | Exceptional 2.7% |
| Ethiopians | 99.0 /100 | #54 | Exceptional 2.7% |
| Immigrants | Ethiopia | 99.0 /100 | #55 | Exceptional 2.7% |
| Immigrants | Nicaragua | 99.0 /100 | #56 | Exceptional 2.7% |
| South Americans | 99.0 /100 | #57 | Exceptional 2.7% |
Demographics Similar to Immigrants from Afghanistan by Hearing Disability
In terms of hearing disability, the demographic groups most similar to Immigrants from Afghanistan are Immigrants from Honduras (2.8%, a difference of 0.060%), Immigrants from Guatemala (2.8%, a difference of 0.10%), Immigrants from Eastern Africa (2.8%, a difference of 0.15%), Immigrants from Somalia (2.8%, a difference of 0.17%), and Immigrants from Spain (2.8%, a difference of 0.21%).
| Demographics | Rating | Rank | Hearing Disability |
| Immigrants | Morocco | 96.6 /100 | #90 | Exceptional 2.8% |
| Immigrants | Middle Africa | 96.5 /100 | #91 | Exceptional 2.8% |
| Iranians | 96.4 /100 | #92 | Exceptional 2.8% |
| Immigrants | Kuwait | 96.3 /100 | #93 | Exceptional 2.8% |
| Uruguayans | 95.9 /100 | #94 | Exceptional 2.8% |
| Israelis | 95.9 /100 | #95 | Exceptional 2.8% |
| Immigrants | Somalia | 95.5 /100 | #96 | Exceptional 2.8% |
| Immigrants | Afghanistan | 95.3 /100 | #97 | Exceptional 2.8% |
| Immigrants | Honduras | 95.1 /100 | #98 | Exceptional 2.8% |
| Immigrants | Guatemala | 95.1 /100 | #99 | Exceptional 2.8% |
| Immigrants | Eastern Africa | 95.0 /100 | #100 | Exceptional 2.8% |
| Immigrants | Spain | 94.9 /100 | #101 | Exceptional 2.8% |
| Taiwanese | 94.8 /100 | #102 | Exceptional 2.8% |
| Immigrants | Indonesia | 94.7 /100 | #103 | Exceptional 2.8% |
| Burmese | 94.2 /100 | #104 | Exceptional 2.8% |