Cheyenne vs South African Disability
COMPARE
Cheyenne
South African
Disability
Disability Comparison
Cheyenne
South Africans
13.0%
DISABILITY
0.0/ 100
METRIC RATING
290th/ 347
METRIC RANK
11.4%
DISABILITY
92.3/ 100
METRIC RATING
123rd/ 347
METRIC RANK
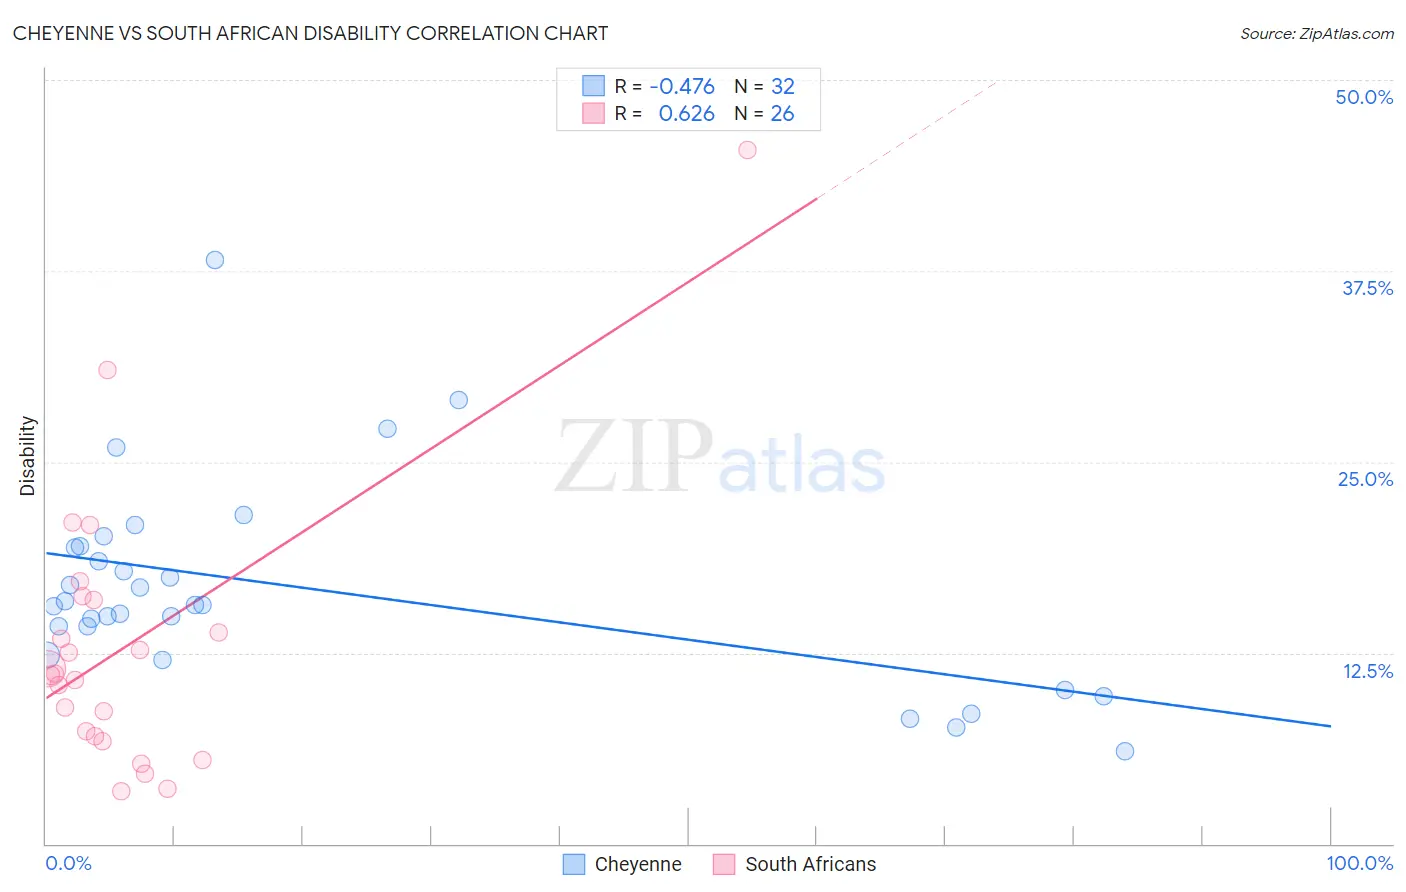
Cheyenne vs South African Disability Correlation Chart
The statistical analysis conducted on geographies consisting of 80,710,371 people shows a moderate negative correlation between the proportion of Cheyenne and percentage of population with a disability in the United States with a correlation coefficient (R) of -0.476 and weighted average of 13.0%. Similarly, the statistical analysis conducted on geographies consisting of 182,593,286 people shows a significant positive correlation between the proportion of South Africans and percentage of population with a disability in the United States with a correlation coefficient (R) of 0.626 and weighted average of 11.4%, a difference of 14.4%.
Disability Correlation Summary
| Measurement | Cheyenne | South African |
| Minimum | 6.1% | 3.4% |
| Maximum | 38.2% | 45.5% |
| Range | 32.2% | 42.0% |
| Mean | 16.7% | 12.9% |
| Median | 15.6% | 11.1% |
| Interquartile 25% (IQ1) | 13.3% | 7.0% |
| Interquartile 75% (IQ3) | 19.4% | 15.9% |
| Interquartile Range (IQR) | 6.1% | 8.9% |
| Standard Deviation (Sample) | 6.7% | 9.1% |
| Standard Deviation (Population) | 6.6% | 8.9% |
Similar Demographics by Disability
Demographics Similar to Cheyenne by Disability
In terms of disability, the demographic groups most similar to Cheyenne are White/Caucasian (13.0%, a difference of 0.060%), Slovak (13.0%, a difference of 0.060%), African (13.0%, a difference of 0.080%), Yaqui (13.1%, a difference of 0.23%), and English (13.0%, a difference of 0.49%).
| Demographics | Rating | Rank | Disability |
| Irish | 0.0 /100 | #283 | Tragic 12.9% |
| Welsh | 0.0 /100 | #284 | Tragic 12.9% |
| Crow | 0.0 /100 | #285 | Tragic 12.9% |
| English | 0.0 /100 | #286 | Tragic 13.0% |
| Africans | 0.0 /100 | #287 | Tragic 13.0% |
| Whites/Caucasians | 0.0 /100 | #288 | Tragic 13.0% |
| Slovaks | 0.0 /100 | #289 | Tragic 13.0% |
| Cheyenne | 0.0 /100 | #290 | Tragic 13.0% |
| Yaqui | 0.0 /100 | #291 | Tragic 13.1% |
| Aleuts | 0.0 /100 | #292 | Tragic 13.1% |
| Marshallese | 0.0 /100 | #293 | Tragic 13.1% |
| Celtics | 0.0 /100 | #294 | Tragic 13.1% |
| Immigrants | Nonimmigrants | 0.0 /100 | #295 | Tragic 13.2% |
| Central American Indians | 0.0 /100 | #296 | Tragic 13.2% |
| Hopi | 0.0 /100 | #297 | Tragic 13.2% |
Demographics Similar to South Africans by Disability
In terms of disability, the demographic groups most similar to South Africans are South American Indian (11.4%, a difference of 0.020%), Costa Rican (11.4%, a difference of 0.060%), Brazilian (11.4%, a difference of 0.17%), Immigrants from Costa Rica (11.4%, a difference of 0.20%), and Central American (11.4%, a difference of 0.21%).
| Demographics | Rating | Rank | Disability |
| Immigrants | Northern Europe | 94.1 /100 | #116 | Exceptional 11.3% |
| Luxembourgers | 93.9 /100 | #117 | Exceptional 11.3% |
| Koreans | 93.8 /100 | #118 | Exceptional 11.3% |
| Central Americans | 93.5 /100 | #119 | Exceptional 11.4% |
| Immigrants | North Macedonia | 93.5 /100 | #120 | Exceptional 11.4% |
| Immigrants | Costa Rica | 93.4 /100 | #121 | Exceptional 11.4% |
| Brazilians | 93.3 /100 | #122 | Exceptional 11.4% |
| South Africans | 92.3 /100 | #123 | Exceptional 11.4% |
| South American Indians | 92.2 /100 | #124 | Exceptional 11.4% |
| Costa Ricans | 91.9 /100 | #125 | Exceptional 11.4% |
| Immigrants | Latvia | 90.9 /100 | #126 | Exceptional 11.4% |
| Immigrants | Italy | 90.4 /100 | #127 | Exceptional 11.4% |
| Immigrants | Europe | 90.4 /100 | #128 | Exceptional 11.4% |
| Macedonians | 90.3 /100 | #129 | Exceptional 11.4% |
| Latvians | 89.8 /100 | #130 | Excellent 11.4% |