Cherokee vs Cree Ambulatory Disability
COMPARE
Cherokee
Cree
Ambulatory Disability
Ambulatory Disability Comparison
Cherokee
Cree
7.9%
AMBULATORY DISABILITY
0.0/ 100
METRIC RATING
333rd/ 347
METRIC RANK
7.1%
AMBULATORY DISABILITY
0.0/ 100
METRIC RATING
311th/ 347
METRIC RANK
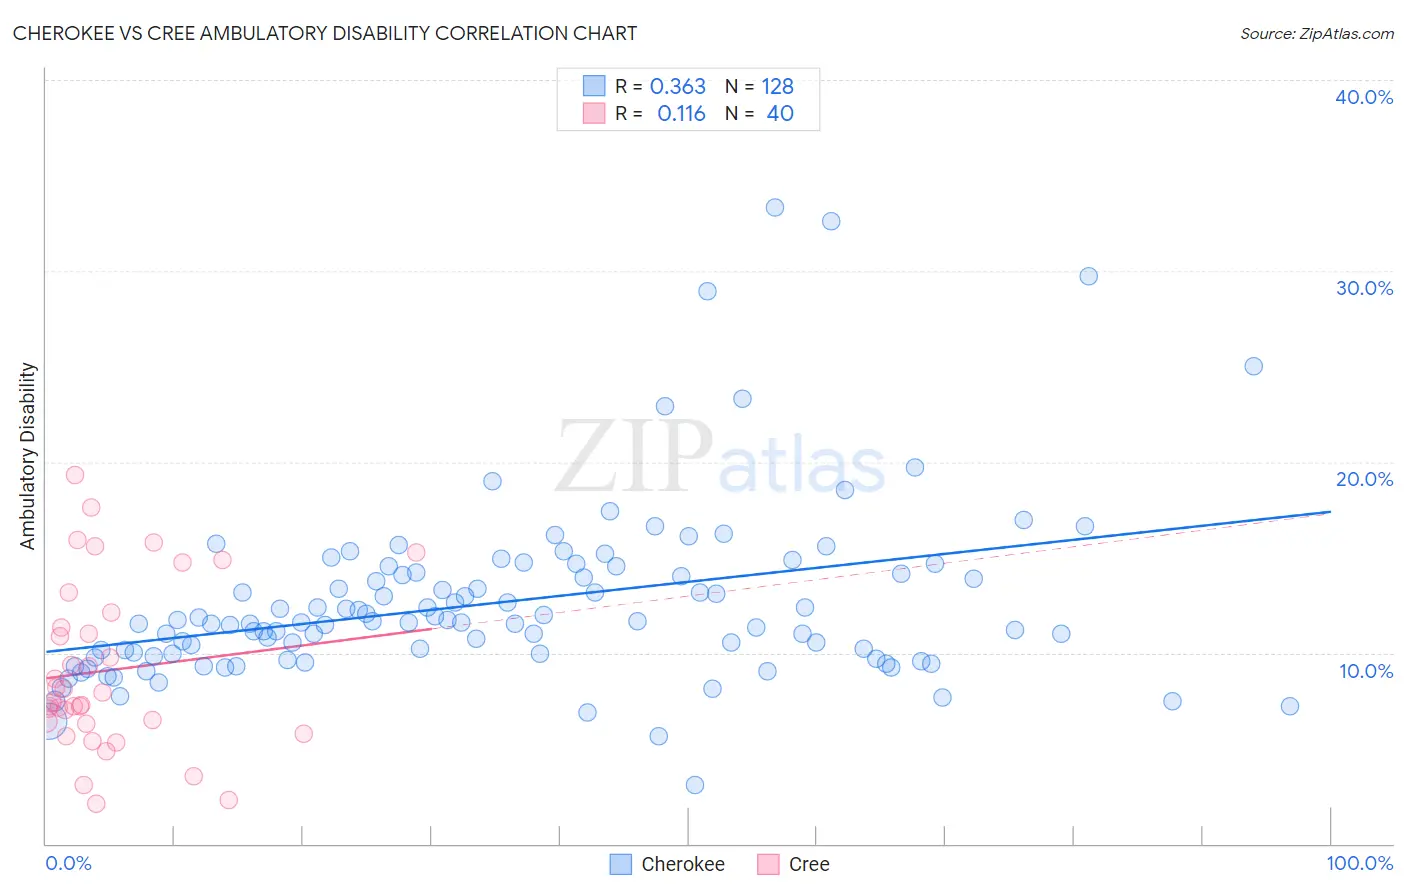
Cherokee vs Cree Ambulatory Disability Correlation Chart
The statistical analysis conducted on geographies consisting of 493,453,063 people shows a mild positive correlation between the proportion of Cherokee and percentage of population with ambulatory disability in the United States with a correlation coefficient (R) of 0.363 and weighted average of 7.9%. Similarly, the statistical analysis conducted on geographies consisting of 76,208,414 people shows a poor positive correlation between the proportion of Cree and percentage of population with ambulatory disability in the United States with a correlation coefficient (R) of 0.116 and weighted average of 7.1%, a difference of 10.8%.
Ambulatory Disability Correlation Summary
| Measurement | Cherokee | Cree |
| Minimum | 3.1% | 2.1% |
| Maximum | 33.3% | 19.3% |
| Range | 30.2% | 17.2% |
| Mean | 12.6% | 9.1% |
| Median | 11.6% | 7.7% |
| Interquartile 25% (IQ1) | 9.9% | 6.4% |
| Interquartile 75% (IQ3) | 14.2% | 11.7% |
| Interquartile Range (IQR) | 4.3% | 5.3% |
| Standard Deviation (Sample) | 4.7% | 4.3% |
| Standard Deviation (Population) | 4.7% | 4.3% |
Similar Demographics by Ambulatory Disability
Demographics Similar to Cherokee by Ambulatory Disability
In terms of ambulatory disability, the demographic groups most similar to Cherokee are Menominee (7.8%, a difference of 0.89%), Yuman (7.9%, a difference of 0.94%), Cajun (7.8%, a difference of 1.2%), Chickasaw (8.0%, a difference of 2.1%), and Seminole (8.0%, a difference of 2.1%).
| Demographics | Rating | Rank | Ambulatory Disability |
| Blacks/African Americans | 0.0 /100 | #326 | Tragic 7.5% |
| Natives/Alaskans | 0.0 /100 | #327 | Tragic 7.5% |
| Hopi | 0.0 /100 | #328 | Tragic 7.6% |
| Pueblo | 0.0 /100 | #329 | Tragic 7.6% |
| Paiute | 0.0 /100 | #330 | Tragic 7.7% |
| Cajuns | 0.0 /100 | #331 | Tragic 7.8% |
| Menominee | 0.0 /100 | #332 | Tragic 7.8% |
| Cherokee | 0.0 /100 | #333 | Tragic 7.9% |
| Yuman | 0.0 /100 | #334 | Tragic 7.9% |
| Chickasaw | 0.0 /100 | #335 | Tragic 8.0% |
| Seminole | 0.0 /100 | #336 | Tragic 8.0% |
| Dutch West Indians | 0.0 /100 | #337 | Tragic 8.2% |
| Colville | 0.0 /100 | #338 | Tragic 8.2% |
| Pima | 0.0 /100 | #339 | Tragic 8.2% |
| Choctaw | 0.0 /100 | #340 | Tragic 8.3% |
Demographics Similar to Cree by Ambulatory Disability
In terms of ambulatory disability, the demographic groups most similar to Cree are Arapaho (7.1%, a difference of 0.010%), Delaware (7.1%, a difference of 0.22%), Immigrants from the Azores (7.1%, a difference of 0.29%), Immigrants from Yemen (7.1%, a difference of 0.35%), and Blackfeet (7.1%, a difference of 0.38%).
| Demographics | Rating | Rank | Ambulatory Disability |
| Immigrants | Cabo Verde | 0.0 /100 | #304 | Tragic 7.0% |
| Immigrants | Micronesia | 0.0 /100 | #305 | Tragic 7.0% |
| Iroquois | 0.0 /100 | #306 | Tragic 7.1% |
| Spanish Americans | 0.0 /100 | #307 | Tragic 7.1% |
| Chippewa | 0.0 /100 | #308 | Tragic 7.1% |
| Immigrants | Azores | 0.0 /100 | #309 | Tragic 7.1% |
| Arapaho | 0.0 /100 | #310 | Tragic 7.1% |
| Cree | 0.0 /100 | #311 | Tragic 7.1% |
| Delaware | 0.0 /100 | #312 | Tragic 7.1% |
| Immigrants | Yemen | 0.0 /100 | #313 | Tragic 7.1% |
| Blackfeet | 0.0 /100 | #314 | Tragic 7.1% |
| Shoshone | 0.0 /100 | #315 | Tragic 7.1% |
| Immigrants | Dominican Republic | 0.0 /100 | #316 | Tragic 7.1% |
| Central American Indians | 0.0 /100 | #317 | Tragic 7.2% |
| Ottawa | 0.0 /100 | #318 | Tragic 7.2% |