Cherokee vs Immigrants from Morocco Ambulatory Disability
COMPARE
Cherokee
Immigrants from Morocco
Ambulatory Disability
Ambulatory Disability Comparison
Cherokee
Immigrants from Morocco
7.9%
AMBULATORY DISABILITY
0.0/ 100
METRIC RATING
333rd/ 347
METRIC RANK
5.8%
AMBULATORY DISABILITY
97.3/ 100
METRIC RATING
106th/ 347
METRIC RANK
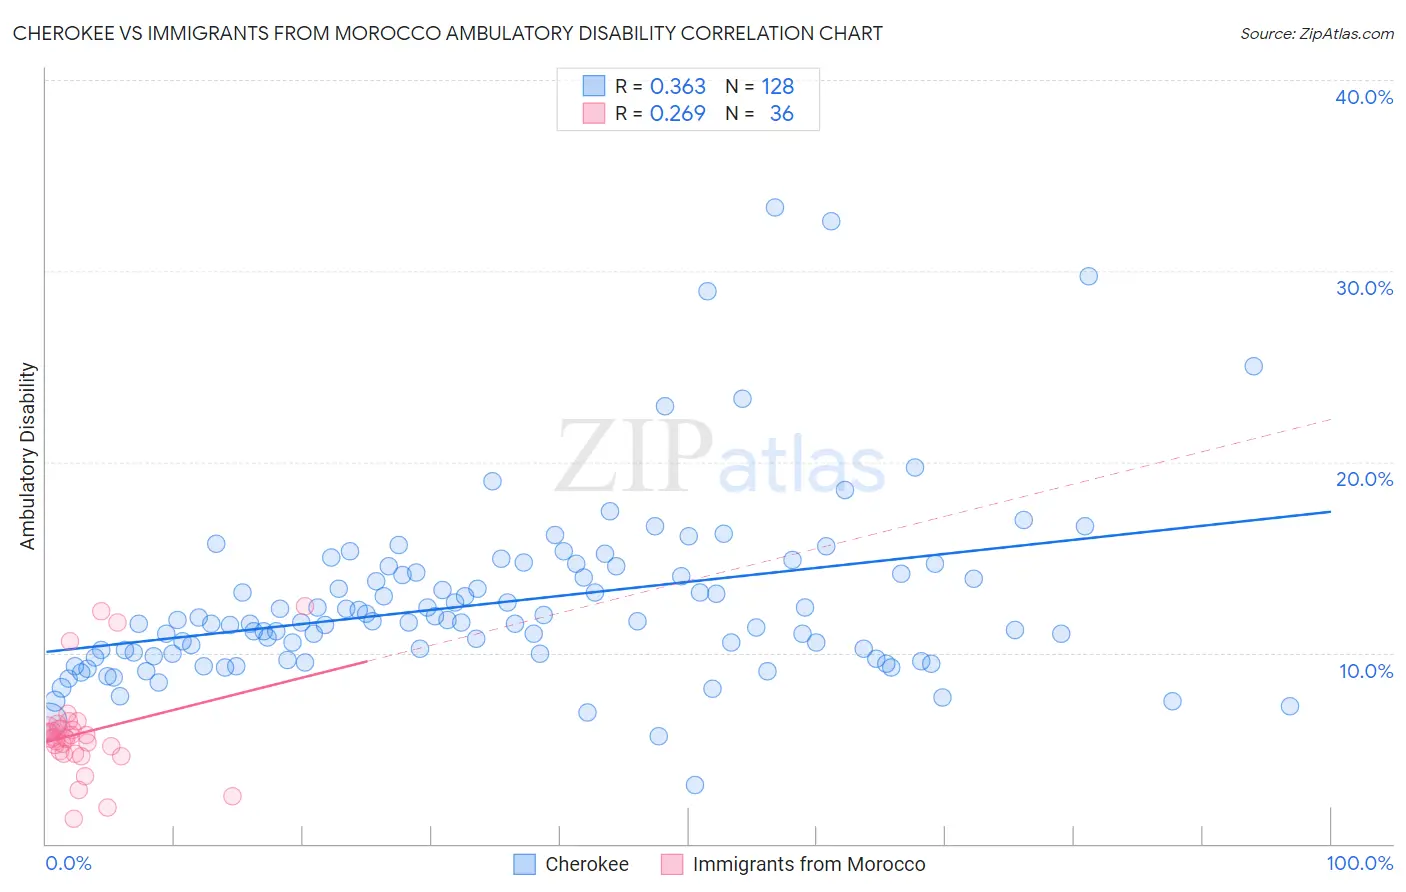
Cherokee vs Immigrants from Morocco Ambulatory Disability Correlation Chart
The statistical analysis conducted on geographies consisting of 493,453,063 people shows a mild positive correlation between the proportion of Cherokee and percentage of population with ambulatory disability in the United States with a correlation coefficient (R) of 0.363 and weighted average of 7.9%. Similarly, the statistical analysis conducted on geographies consisting of 178,910,370 people shows a weak positive correlation between the proportion of Immigrants from Morocco and percentage of population with ambulatory disability in the United States with a correlation coefficient (R) of 0.269 and weighted average of 5.8%, a difference of 35.1%.
Ambulatory Disability Correlation Summary
| Measurement | Cherokee | Immigrants from Morocco |
| Minimum | 3.1% | 1.3% |
| Maximum | 33.3% | 12.4% |
| Range | 30.2% | 11.1% |
| Mean | 12.6% | 5.8% |
| Median | 11.6% | 5.6% |
| Interquartile 25% (IQ1) | 9.9% | 4.8% |
| Interquartile 75% (IQ3) | 14.2% | 6.0% |
| Interquartile Range (IQR) | 4.3% | 1.3% |
| Standard Deviation (Sample) | 4.7% | 2.5% |
| Standard Deviation (Population) | 4.7% | 2.4% |
Similar Demographics by Ambulatory Disability
Demographics Similar to Cherokee by Ambulatory Disability
In terms of ambulatory disability, the demographic groups most similar to Cherokee are Menominee (7.8%, a difference of 0.89%), Yuman (7.9%, a difference of 0.94%), Cajun (7.8%, a difference of 1.2%), Chickasaw (8.0%, a difference of 2.1%), and Seminole (8.0%, a difference of 2.1%).
| Demographics | Rating | Rank | Ambulatory Disability |
| Blacks/African Americans | 0.0 /100 | #326 | Tragic 7.5% |
| Natives/Alaskans | 0.0 /100 | #327 | Tragic 7.5% |
| Hopi | 0.0 /100 | #328 | Tragic 7.6% |
| Pueblo | 0.0 /100 | #329 | Tragic 7.6% |
| Paiute | 0.0 /100 | #330 | Tragic 7.7% |
| Cajuns | 0.0 /100 | #331 | Tragic 7.8% |
| Menominee | 0.0 /100 | #332 | Tragic 7.8% |
| Cherokee | 0.0 /100 | #333 | Tragic 7.9% |
| Yuman | 0.0 /100 | #334 | Tragic 7.9% |
| Chickasaw | 0.0 /100 | #335 | Tragic 8.0% |
| Seminole | 0.0 /100 | #336 | Tragic 8.0% |
| Dutch West Indians | 0.0 /100 | #337 | Tragic 8.2% |
| Colville | 0.0 /100 | #338 | Tragic 8.2% |
| Pima | 0.0 /100 | #339 | Tragic 8.2% |
| Choctaw | 0.0 /100 | #340 | Tragic 8.3% |
Demographics Similar to Immigrants from Morocco by Ambulatory Disability
In terms of ambulatory disability, the demographic groups most similar to Immigrants from Morocco are Uruguayan (5.8%, a difference of 0.050%), Immigrants from Czechoslovakia (5.8%, a difference of 0.070%), Colombian (5.8%, a difference of 0.070%), Immigrants from Netherlands (5.8%, a difference of 0.080%), and New Zealander (5.8%, a difference of 0.18%).
| Demographics | Rating | Rank | Ambulatory Disability |
| Immigrants | Northern Europe | 98.2 /100 | #99 | Exceptional 5.8% |
| Immigrants | Serbia | 97.9 /100 | #100 | Exceptional 5.8% |
| Immigrants | South America | 97.9 /100 | #101 | Exceptional 5.8% |
| Immigrants | Kenya | 97.8 /100 | #102 | Exceptional 5.8% |
| Immigrants | Romania | 97.7 /100 | #103 | Exceptional 5.8% |
| New Zealanders | 97.6 /100 | #104 | Exceptional 5.8% |
| Immigrants | Czechoslovakia | 97.4 /100 | #105 | Exceptional 5.8% |
| Immigrants | Morocco | 97.3 /100 | #106 | Exceptional 5.8% |
| Uruguayans | 97.2 /100 | #107 | Exceptional 5.8% |
| Colombians | 97.2 /100 | #108 | Exceptional 5.8% |
| Immigrants | Netherlands | 97.1 /100 | #109 | Exceptional 5.8% |
| Immigrants | Colombia | 96.7 /100 | #110 | Exceptional 5.8% |
| Danes | 96.6 /100 | #111 | Exceptional 5.8% |
| South Africans | 96.3 /100 | #112 | Exceptional 5.9% |
| Immigrants | Uruguay | 95.6 /100 | #113 | Exceptional 5.9% |