Immigrants from Nicaragua vs Cree Ambulatory Disability

COMPARE

Immigrants from Nicaragua
Race
Ancestry
AfghanAfricanAlaska NativeAlaskan AthabascanAlbanianAleutAlsatianAmericanApacheArabArapahoArgentineanArmenianAssyrian/Chaldean/SyriacAustralianAustrianBahamianBangladeshiBarbadianBasqueBelgianBelizeanBermudanBhutaneseBlackfeetBolivianBrazilianBritishBritish West IndianBulgarianBurmeseCajunCambodianCanadianCape VerdeanCarpatho RusynCelticCentral AmericanCentral American IndianCherokeeCheyenneChickasawChileanChineseChippewaChoctawColombianColvilleComancheCosta RicanCreekCroatianCrowCubanCypriotCzechCzechoslovakianDanishDelawareDominicanDutchDutch West IndianEastern EuropeanEcuadorianEgyptianEnglishEstonianEthiopianEuropeanFijianFilipinoFinnishFrenchFrench American IndianFrench CanadianGermanGerman RussianGhanaianGreekGuamanian/ChamorroGuatemalanGuyaneseHaitianHmongHonduranHopiHoumaHungarianIcelanderIndian (Asian)IndonesianInupiatIranianIraqiIrishIroquoisIsraeliItalianJamaicanJapaneseJordanianKenyanKiowaKoreanLaotianLatvianLebaneseLiberianLithuanianLumbeeLuxembourgerMacedonianMalaysianMalteseMarshalleseMenomineeMexicanMexican American IndianMongolianMoroccanNative HawaiianNavajoNepaleseNew ZealanderNicaraguanNigerianNorthern EuropeanNorwegianOkinawanOsageOttawaPaiutePakistaniPalestinianPanamanianParaguayanPennsylvania GermanPeruvianPimaPolishPortuguesePotawatomiPuebloPuerto RicanPuget Sound SalishRomanianRussianSalvadoranSamoanScandinavianScotch-IrishScottishSeminoleSenegaleseSerbianShoshoneSierra LeoneanSiouxSlavicSlovakSloveneSomaliSouth AfricanSouth AmericanSouth American IndianSoviet UnionSpaniardSpanishSpanish AmericanSpanish American IndianSri LankanSubsaharan AfricanSudaneseSwedishSwissSyrianTaiwaneseThaiTlingit-HaidaTohono O'OdhamTonganTrinidadian and TobagonianTsimshianTurkishU.S. Virgin IslanderUgandanUkrainianUruguayanUteVenezuelanVietnameseWelshWest IndianYakamaYaquiYugoslavianYumanYup'ikZimbabwean
Immigration
NonimmigrantsImmigrantsAfghanistanAfricaAlbaniaArgentinaArmeniaAsiaAustraliaAustriaBahamasBangladeshBarbadosBelarusBelgiumBelizeBoliviaBosnia and HerzegovinaBrazilBulgariaBurma/MyanmarCabo VerdeCambodiaCameroonCanadaCaribbeanCentral AmericaChileChinaColombiaCongoCosta RicaCroatiaCubaCzechoslovakiaDenmarkDominicaDominican RepublicEastern AfricaEastern AsiaEastern EuropeEcuadorEgyptEl SalvadorEnglandEritreaEthiopiaEuropeFijiFranceGermanyGhanaGreeceGrenadaGuatemalaGuyanaHaitiHondurasHong KongHungaryIndiaIndonesiaIranIraqIrelandIsraelItalyJamaicaJapanJordanKazakhstanKenyaKoreaKuwaitLaosLatin AmericaLatviaLebanonLiberiaLithuaniaMalaysiaMexicoMicronesiaMiddle AfricaMoldovaMoroccoNepalNetherlandsNicaraguaNigeriaNorth AmericaNorth MacedoniaNorthern AfricaNorthern EuropeNorwayOceaniaPakistanPanamaPeruPhilippinesPolandPortugalRomaniaRussiaSaudi ArabiaScotlandSenegalSerbiaSierra LeoneSingaporeSomaliaSouth AfricaSouth AmericaSouth Central AsiaSouth Eastern AsiaSouthern EuropeSpainSri LankaSt. Vincent and the GrenadinesSudanSwedenSwitzerlandSyriaTaiwanThailandTrinidad and TobagoTurkeyUgandaUkraineUruguayUzbekistanVenezuelaVietnamWest IndiesWestern AfricaWestern AsiaWestern EuropeYemenZaireZimbabweAzores
Cree
Race
Ancestry
AfghanAfricanAlaska NativeAlaskan AthabascanAlbanianAleutAlsatianAmericanApacheArabArapahoArgentineanArmenianAssyrian/Chaldean/SyriacAustralianAustrianBahamianBangladeshiBarbadianBasqueBelgianBelizeanBermudanBhutaneseBlackfeetBolivianBrazilianBritishBritish West IndianBulgarianBurmeseCajunCambodianCanadianCape VerdeanCarpatho RusynCelticCentral AmericanCentral American IndianCherokeeCheyenneChickasawChileanChineseChippewaChoctawColombianColvilleComancheCosta RicanCreeCreekCroatianCrowCubanCypriotCzechCzechoslovakianDanishDelawareDominicanDutchDutch West IndianEastern EuropeanEcuadorianEgyptianEnglishEstonianEthiopianEuropeanFijianFilipinoFinnishFrenchFrench American IndianFrench CanadianGermanGerman RussianGhanaianGreekGuamanian/ChamorroGuatemalanGuyaneseHaitianHmongHonduranHopiHoumaHungarianIcelanderIndian (Asian)IndonesianInupiatIranianIraqiIrishIroquoisIsraeliItalianJamaicanJapaneseJordanianKenyanKiowaKoreanLaotianLatvianLebaneseLiberianLithuanianLumbeeLuxembourgerMacedonianMalaysianMalteseMarshalleseMenomineeMexicanMexican American IndianMongolianMoroccanNative HawaiianNavajoNepaleseNew ZealanderNicaraguanNigerianNorthern EuropeanNorwegianOkinawanOsageOttawaPaiutePakistaniPalestinianPanamanianParaguayanPennsylvania GermanPeruvianPimaPolishPortuguesePotawatomiPuebloPuerto RicanPuget Sound SalishRomanianRussianSalvadoranSamoanScandinavianScotch-IrishScottishSeminoleSenegaleseSerbianShoshoneSierra LeoneanSiouxSlavicSlovakSloveneSomaliSouth AfricanSouth AmericanSouth American IndianSoviet UnionSpaniardSpanishSpanish AmericanSpanish American IndianSri LankanSubsaharan AfricanSudaneseSwedishSwissSyrianTaiwaneseThaiTlingit-HaidaTohono O'OdhamTonganTrinidadian and TobagonianTsimshianTurkishU.S. Virgin IslanderUgandanUkrainianUruguayanUteVenezuelanVietnameseWelshWest IndianYakamaYaquiYugoslavianYumanYup'ikZimbabwean
Immigration
NonimmigrantsImmigrantsAfghanistanAfricaAlbaniaArgentinaArmeniaAsiaAustraliaAustriaBahamasBangladeshBarbadosBelarusBelgiumBelizeBoliviaBosnia and HerzegovinaBrazilBulgariaBurma/MyanmarCabo VerdeCambodiaCameroonCanadaCaribbeanCentral AmericaChileChinaColombiaCongoCosta RicaCroatiaCubaCzechoslovakiaDenmarkDominicaDominican RepublicEastern AfricaEastern AsiaEastern EuropeEcuadorEgyptEl SalvadorEnglandEritreaEthiopiaEuropeFijiFranceGermanyGhanaGreeceGrenadaGuatemalaGuyanaHaitiHondurasHong KongHungaryIndiaIndonesiaIranIraqIrelandIsraelItalyJamaicaJapanJordanKazakhstanKenyaKoreaKuwaitLaosLatin AmericaLatviaLebanonLiberiaLithuaniaMalaysiaMexicoMicronesiaMiddle AfricaMoldovaMoroccoNepalNetherlandsNigeriaNorth AmericaNorth MacedoniaNorthern AfricaNorthern EuropeNorwayOceaniaPakistanPanamaPeruPhilippinesPolandPortugalRomaniaRussiaSaudi ArabiaScotlandSenegalSerbiaSierra LeoneSingaporeSomaliaSouth AfricaSouth AmericaSouth Central AsiaSouth Eastern AsiaSouthern EuropeSpainSri LankaSt. Vincent and the GrenadinesSudanSwedenSwitzerlandSyriaTaiwanThailandTrinidad and TobagoTurkeyUgandaUkraineUruguayUzbekistanVenezuelaVietnamWest IndiesWestern AfricaWestern AsiaWestern EuropeYemenZaireZimbabweAzores
Ambulatory Disability
Income
Poverty
Unemployment
Labor Participation
Family Structure
Vehicle Availability
Education Level
Disability

Ambulatory Disability Comparison

Immigrants from Nicaragua

Cree

Average
Tragic
6.1%
AMBULATORY DISABILITY
43.9/ 100
METRIC RATING
180th/ 347
METRIC RANK
7.1%
AMBULATORY DISABILITY
0.0/ 100
METRIC RATING
311th/ 347
METRIC RANK

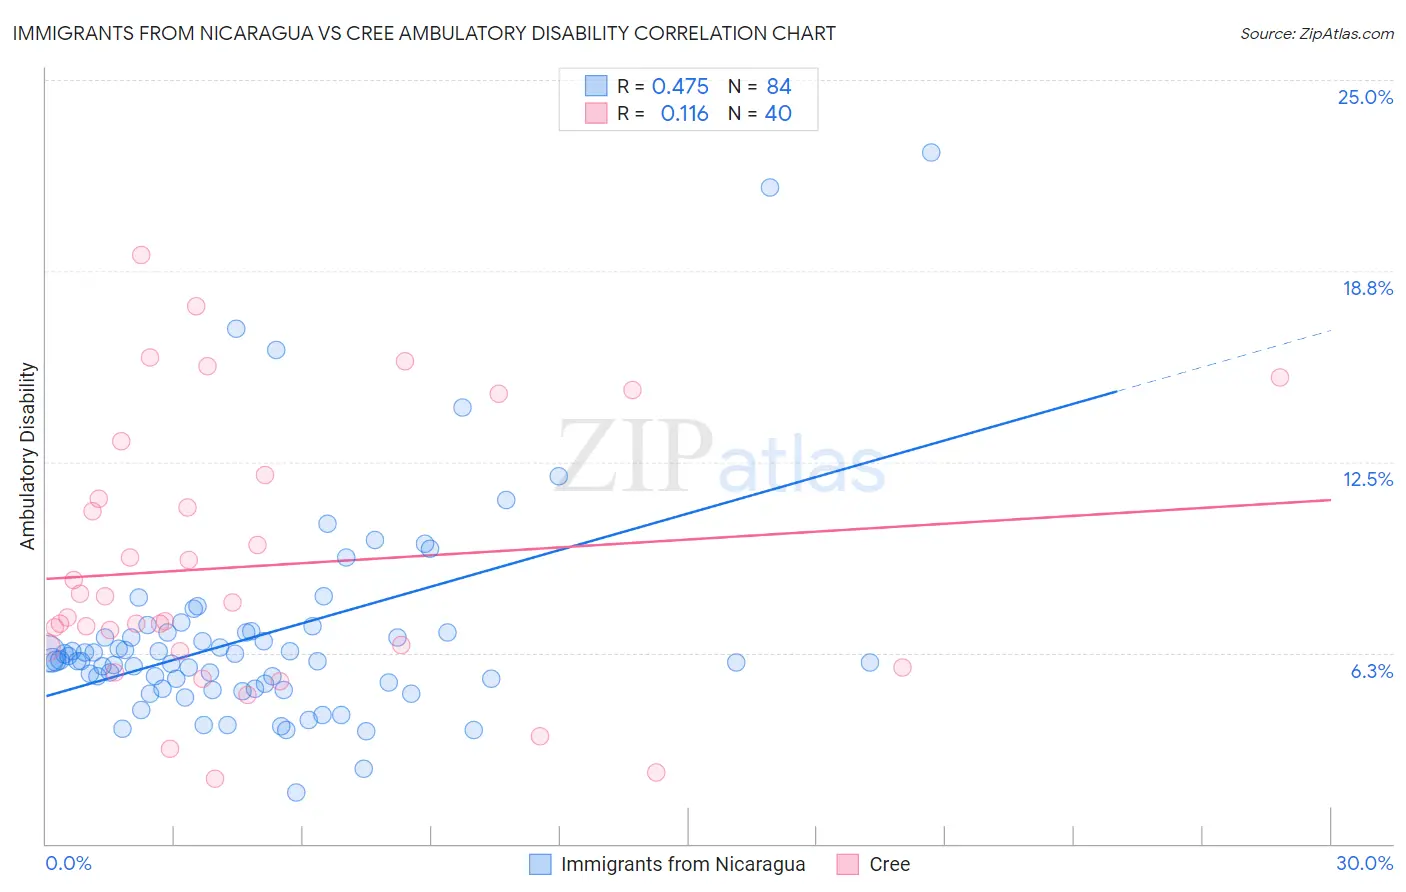
Immigrants from Nicaragua vs Cree Ambulatory Disability Correlation Chart

The statistical analysis conducted on geographies consisting of 236,322,252 people shows a moderate positive correlation between the proportion of Immigrants from Nicaragua and percentage of population with ambulatory disability in the United States with a correlation coefficient (R) of 0.475 and weighted average of 6.1%. Similarly, the statistical analysis conducted on geographies consisting of 76,208,414 people shows a poor positive correlation between the proportion of Cree and percentage of population with ambulatory disability in the United States with a correlation coefficient (R) of 0.116 and weighted average of 7.1%, a difference of 15.7%.
Immigrants from Nicaragua vs Cree Ambulatory Disability

Ambulatory Disability Correlation Summary

MeasurementImmigrants from NicaraguaCree
Minimum1.7%2.1%
Maximum22.6%19.3%
Range20.9%17.2%
Mean6.8%9.1%
Median6.0%7.7%
Interquartile 25% (IQ1)5.2%6.4%
Interquartile 75% (IQ3)6.9%11.7%
Interquartile Range (IQR)1.7%5.3%
Standard Deviation (Sample)3.5%4.3%
Standard Deviation (Population)3.5%4.3%

Similar Demographics by Ambulatory Disability

Demographics Similar to Immigrants from Nicaragua by Ambulatory Disability

In terms of ambulatory disability, the demographic groups most similar to Immigrants from Nicaragua are Austrian (6.1%, a difference of 0.010%), Scandinavian (6.1%, a difference of 0.030%), Swiss (6.1%, a difference of 0.040%), Serbian (6.1%, a difference of 0.060%), and Immigrants from England (6.1%, a difference of 0.080%).
DemographicsRating | RankAmbulatory Disability
Croatians
51.2
/100
|
#173
Average
6.1%
Immigrants | Canada
50.0
/100
|
#174
Average
6.1%
Vietnamese
47.2
/100
|
#175
Average
6.1%
Immigrants | North America
45.6
/100
|
#176
Average
6.1%
Immigrants | England
45.4
/100
|
#177
Average
6.1%
Scandinavians
44.5
/100
|
#178
Average
6.1%
Austrians
44.1
/100
|
#179
Average
6.1%
Immigrants | Nicaragua
43.9
/100
|
#180
Average
6.1%
Swiss
43.1
/100
|
#181
Average
6.1%
Serbians
42.8
/100
|
#182
Average
6.1%
Immigrants | Thailand
42.2
/100
|
#183
Average
6.1%
Immigrants | Ghana
41.2
/100
|
#184
Average
6.1%
Immigrants | Bosnia and Herzegovina
37.2
/100
|
#185
Fair
6.2%
Europeans
36.2
/100
|
#186
Fair
6.2%
Carpatho Rusyns
35.3
/100
|
#187
Fair
6.2%

Demographics Similar to Cree by Ambulatory Disability

In terms of ambulatory disability, the demographic groups most similar to Cree are Arapaho (7.1%, a difference of 0.010%), Delaware (7.1%, a difference of 0.22%), Immigrants from the Azores (7.1%, a difference of 0.29%), Immigrants from Yemen (7.1%, a difference of 0.35%), and Blackfeet (7.1%, a difference of 0.38%).
DemographicsRating | RankAmbulatory Disability
Immigrants | Cabo Verde
0.0
/100
|
#304
Tragic
7.0%
Immigrants | Micronesia
0.0
/100
|
#305
Tragic
7.0%
Iroquois
0.0
/100
|
#306
Tragic
7.1%
Spanish Americans
0.0
/100
|
#307
Tragic
7.1%
Chippewa
0.0
/100
|
#308
Tragic
7.1%
Immigrants | Azores
0.0
/100
|
#309
Tragic
7.1%
Arapaho
0.0
/100
|
#310
Tragic
7.1%
Cree
0.0
/100
|
#311
Tragic
7.1%
Delaware
0.0
/100
|
#312
Tragic
7.1%
Immigrants | Yemen
0.0
/100
|
#313
Tragic
7.1%
Blackfeet
0.0
/100
|
#314
Tragic
7.1%
Shoshone
0.0
/100
|
#315
Tragic
7.1%
Immigrants | Dominican Republic
0.0
/100
|
#316
Tragic
7.1%
Central American Indians
0.0
/100
|
#317
Tragic
7.2%
Ottawa
0.0
/100
|
#318
Tragic
7.2%