Haitian vs Cree Ambulatory Disability
COMPARE
Haitian
Cree
Ambulatory Disability
Ambulatory Disability Comparison
Haitians
Cree
6.4%
AMBULATORY DISABILITY
1.8/ 100
METRIC RATING
238th/ 347
METRIC RANK
7.1%
AMBULATORY DISABILITY
0.0/ 100
METRIC RATING
311th/ 347
METRIC RANK
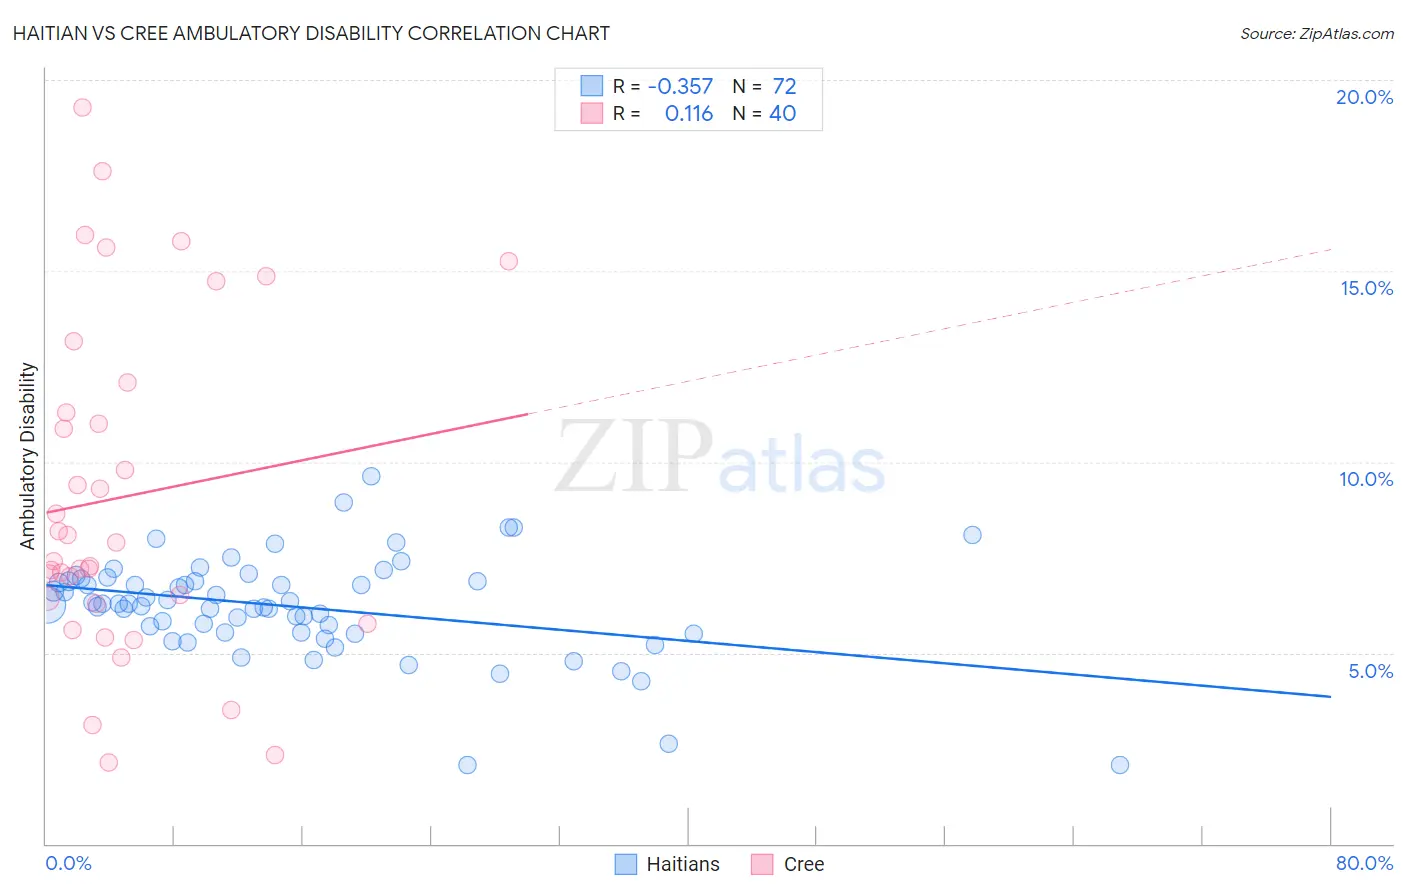
Haitian vs Cree Ambulatory Disability Correlation Chart
The statistical analysis conducted on geographies consisting of 287,779,605 people shows a mild negative correlation between the proportion of Haitians and percentage of population with ambulatory disability in the United States with a correlation coefficient (R) of -0.357 and weighted average of 6.4%. Similarly, the statistical analysis conducted on geographies consisting of 76,208,414 people shows a poor positive correlation between the proportion of Cree and percentage of population with ambulatory disability in the United States with a correlation coefficient (R) of 0.116 and weighted average of 7.1%, a difference of 10.3%.
Ambulatory Disability Correlation Summary
| Measurement | Haitian | Cree |
| Minimum | 2.1% | 2.1% |
| Maximum | 9.6% | 19.3% |
| Range | 7.6% | 17.2% |
| Mean | 6.2% | 9.1% |
| Median | 6.3% | 7.7% |
| Interquartile 25% (IQ1) | 5.5% | 6.4% |
| Interquartile 75% (IQ3) | 6.9% | 11.7% |
| Interquartile Range (IQR) | 1.3% | 5.3% |
| Standard Deviation (Sample) | 1.3% | 4.3% |
| Standard Deviation (Population) | 1.3% | 4.3% |
Similar Demographics by Ambulatory Disability
Demographics Similar to Haitians by Ambulatory Disability
In terms of ambulatory disability, the demographic groups most similar to Haitians are Immigrants from Germany (6.4%, a difference of 0.010%), Senegalese (6.4%, a difference of 0.070%), Immigrants from Senegal (6.4%, a difference of 0.090%), Dutch (6.4%, a difference of 0.10%), and Immigrants from Haiti (6.5%, a difference of 0.18%).
| Demographics | Rating | Rank | Ambulatory Disability |
| Panamanians | 3.1 /100 | #231 | Tragic 6.4% |
| Assyrians/Chaldeans/Syriacs | 2.4 /100 | #232 | Tragic 6.4% |
| Sub-Saharan Africans | 2.3 /100 | #233 | Tragic 6.4% |
| Immigrants | Liberia | 2.3 /100 | #234 | Tragic 6.4% |
| Hispanics or Latinos | 2.2 /100 | #235 | Tragic 6.4% |
| Dutch | 2.0 /100 | #236 | Tragic 6.4% |
| Immigrants | Germany | 1.8 /100 | #237 | Tragic 6.4% |
| Haitians | 1.8 /100 | #238 | Tragic 6.4% |
| Senegalese | 1.7 /100 | #239 | Tragic 6.4% |
| Immigrants | Senegal | 1.7 /100 | #240 | Tragic 6.4% |
| Immigrants | Haiti | 1.6 /100 | #241 | Tragic 6.5% |
| Spaniards | 1.6 /100 | #242 | Tragic 6.5% |
| Germans | 1.5 /100 | #243 | Tragic 6.5% |
| Immigrants | Panama | 1.5 /100 | #244 | Tragic 6.5% |
| Tlingit-Haida | 1.5 /100 | #245 | Tragic 6.5% |
Demographics Similar to Cree by Ambulatory Disability
In terms of ambulatory disability, the demographic groups most similar to Cree are Arapaho (7.1%, a difference of 0.010%), Delaware (7.1%, a difference of 0.22%), Immigrants from the Azores (7.1%, a difference of 0.29%), Immigrants from Yemen (7.1%, a difference of 0.35%), and Blackfeet (7.1%, a difference of 0.38%).
| Demographics | Rating | Rank | Ambulatory Disability |
| Immigrants | Cabo Verde | 0.0 /100 | #304 | Tragic 7.0% |
| Immigrants | Micronesia | 0.0 /100 | #305 | Tragic 7.0% |
| Iroquois | 0.0 /100 | #306 | Tragic 7.1% |
| Spanish Americans | 0.0 /100 | #307 | Tragic 7.1% |
| Chippewa | 0.0 /100 | #308 | Tragic 7.1% |
| Immigrants | Azores | 0.0 /100 | #309 | Tragic 7.1% |
| Arapaho | 0.0 /100 | #310 | Tragic 7.1% |
| Cree | 0.0 /100 | #311 | Tragic 7.1% |
| Delaware | 0.0 /100 | #312 | Tragic 7.1% |
| Immigrants | Yemen | 0.0 /100 | #313 | Tragic 7.1% |
| Blackfeet | 0.0 /100 | #314 | Tragic 7.1% |
| Shoshone | 0.0 /100 | #315 | Tragic 7.1% |
| Immigrants | Dominican Republic | 0.0 /100 | #316 | Tragic 7.1% |
| Central American Indians | 0.0 /100 | #317 | Tragic 7.2% |
| Ottawa | 0.0 /100 | #318 | Tragic 7.2% |