Immigrants from Southern Europe vs Cree Ambulatory Disability
COMPARE
Immigrants from Southern Europe
Cree
Ambulatory Disability
Ambulatory Disability Comparison
Immigrants from Southern Europe
Cree
6.1%
AMBULATORY DISABILITY
58.1/ 100
METRIC RATING
169th/ 347
METRIC RANK
7.1%
AMBULATORY DISABILITY
0.0/ 100
METRIC RATING
311th/ 347
METRIC RANK
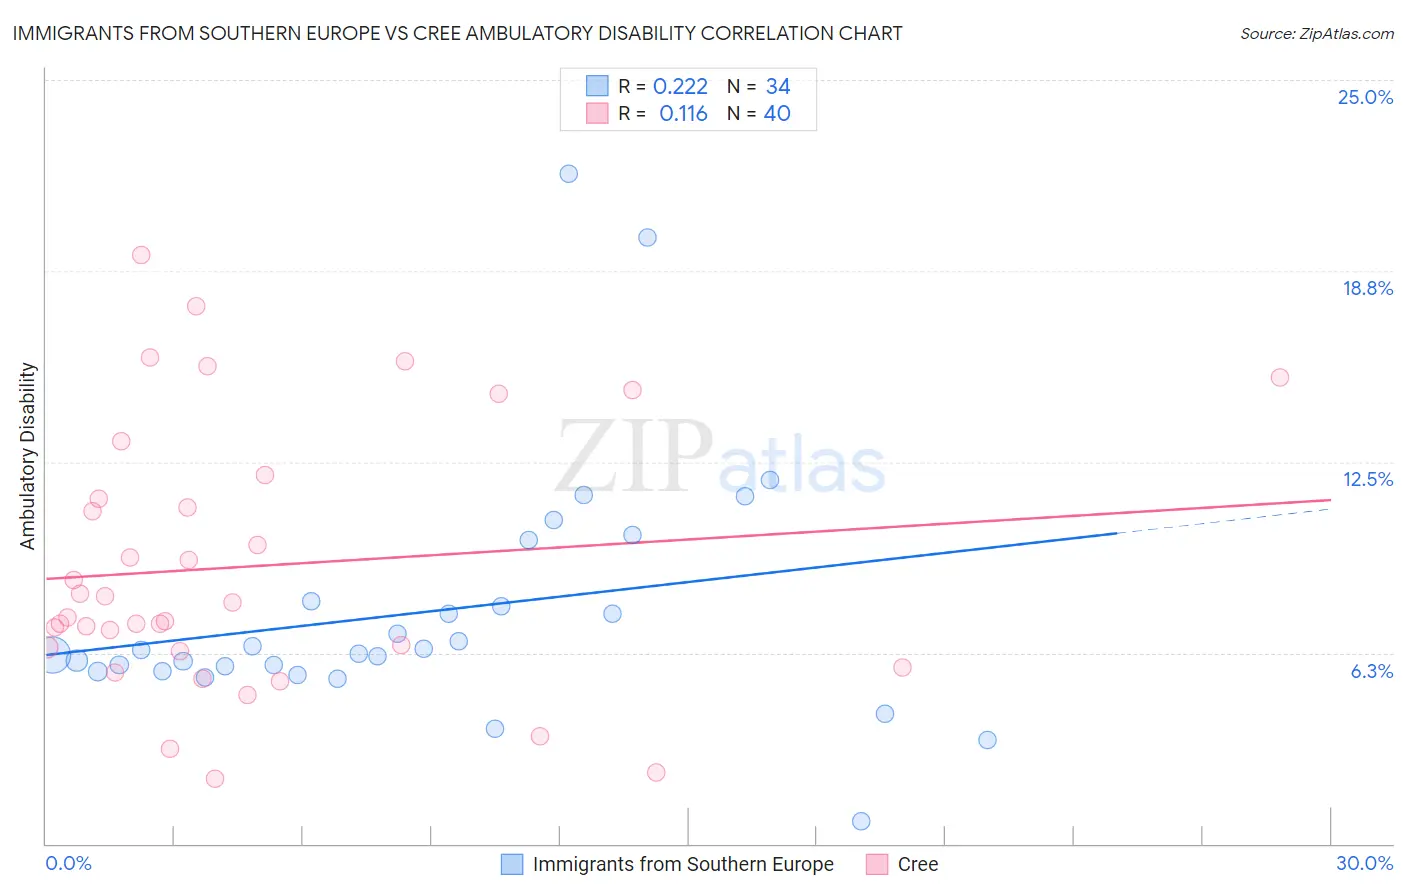
Immigrants from Southern Europe vs Cree Ambulatory Disability Correlation Chart
The statistical analysis conducted on geographies consisting of 402,703,105 people shows a weak positive correlation between the proportion of Immigrants from Southern Europe and percentage of population with ambulatory disability in the United States with a correlation coefficient (R) of 0.222 and weighted average of 6.1%. Similarly, the statistical analysis conducted on geographies consisting of 76,208,414 people shows a poor positive correlation between the proportion of Cree and percentage of population with ambulatory disability in the United States with a correlation coefficient (R) of 0.116 and weighted average of 7.1%, a difference of 16.6%.
Ambulatory Disability Correlation Summary
| Measurement | Immigrants from Southern Europe | Cree |
| Minimum | 0.74% | 2.1% |
| Maximum | 22.0% | 19.3% |
| Range | 21.2% | 17.2% |
| Mean | 7.6% | 9.1% |
| Median | 6.3% | 7.7% |
| Interquartile 25% (IQ1) | 5.7% | 6.4% |
| Interquartile 75% (IQ3) | 7.9% | 11.7% |
| Interquartile Range (IQR) | 2.3% | 5.3% |
| Standard Deviation (Sample) | 4.1% | 4.3% |
| Standard Deviation (Population) | 4.1% | 4.3% |
Similar Demographics by Ambulatory Disability
Demographics Similar to Immigrants from Southern Europe by Ambulatory Disability
In terms of ambulatory disability, the demographic groups most similar to Immigrants from Southern Europe are Ecuadorian (6.1%, a difference of 0.14%), Immigrants from Oceania (6.1%, a difference of 0.15%), Immigrants from Ecuador (6.1%, a difference of 0.23%), Iraqi (6.1%, a difference of 0.26%), and Nicaraguan (6.1%, a difference of 0.29%).
| Demographics | Rating | Rank | Ambulatory Disability |
| Nigerians | 67.1 /100 | #162 | Good 6.1% |
| Lebanese | 66.2 /100 | #163 | Good 6.1% |
| Basques | 63.7 /100 | #164 | Good 6.1% |
| Nicaraguans | 63.2 /100 | #165 | Good 6.1% |
| Iraqis | 62.8 /100 | #166 | Good 6.1% |
| Immigrants | Oceania | 60.7 /100 | #167 | Good 6.1% |
| Ecuadorians | 60.5 /100 | #168 | Good 6.1% |
| Immigrants | Southern Europe | 58.1 /100 | #169 | Average 6.1% |
| Immigrants | Ecuador | 53.8 /100 | #170 | Average 6.1% |
| Moroccans | 52.6 /100 | #171 | Average 6.1% |
| Immigrants | Burma/Myanmar | 52.2 /100 | #172 | Average 6.1% |
| Croatians | 51.2 /100 | #173 | Average 6.1% |
| Immigrants | Canada | 50.0 /100 | #174 | Average 6.1% |
| Vietnamese | 47.2 /100 | #175 | Average 6.1% |
| Immigrants | North America | 45.6 /100 | #176 | Average 6.1% |
Demographics Similar to Cree by Ambulatory Disability
In terms of ambulatory disability, the demographic groups most similar to Cree are Arapaho (7.1%, a difference of 0.010%), Delaware (7.1%, a difference of 0.22%), Immigrants from the Azores (7.1%, a difference of 0.29%), Immigrants from Yemen (7.1%, a difference of 0.35%), and Blackfeet (7.1%, a difference of 0.38%).
| Demographics | Rating | Rank | Ambulatory Disability |
| Immigrants | Cabo Verde | 0.0 /100 | #304 | Tragic 7.0% |
| Immigrants | Micronesia | 0.0 /100 | #305 | Tragic 7.0% |
| Iroquois | 0.0 /100 | #306 | Tragic 7.1% |
| Spanish Americans | 0.0 /100 | #307 | Tragic 7.1% |
| Chippewa | 0.0 /100 | #308 | Tragic 7.1% |
| Immigrants | Azores | 0.0 /100 | #309 | Tragic 7.1% |
| Arapaho | 0.0 /100 | #310 | Tragic 7.1% |
| Cree | 0.0 /100 | #311 | Tragic 7.1% |
| Delaware | 0.0 /100 | #312 | Tragic 7.1% |
| Immigrants | Yemen | 0.0 /100 | #313 | Tragic 7.1% |
| Blackfeet | 0.0 /100 | #314 | Tragic 7.1% |
| Shoshone | 0.0 /100 | #315 | Tragic 7.1% |
| Immigrants | Dominican Republic | 0.0 /100 | #316 | Tragic 7.1% |
| Central American Indians | 0.0 /100 | #317 | Tragic 7.2% |
| Ottawa | 0.0 /100 | #318 | Tragic 7.2% |