Albanian vs Cree Ambulatory Disability
COMPARE
Albanian
Cree
Ambulatory Disability
Ambulatory Disability Comparison
Albanians
Cree
6.2%
AMBULATORY DISABILITY
19.7/ 100
METRIC RATING
202nd/ 347
METRIC RANK
7.1%
AMBULATORY DISABILITY
0.0/ 100
METRIC RATING
311th/ 347
METRIC RANK
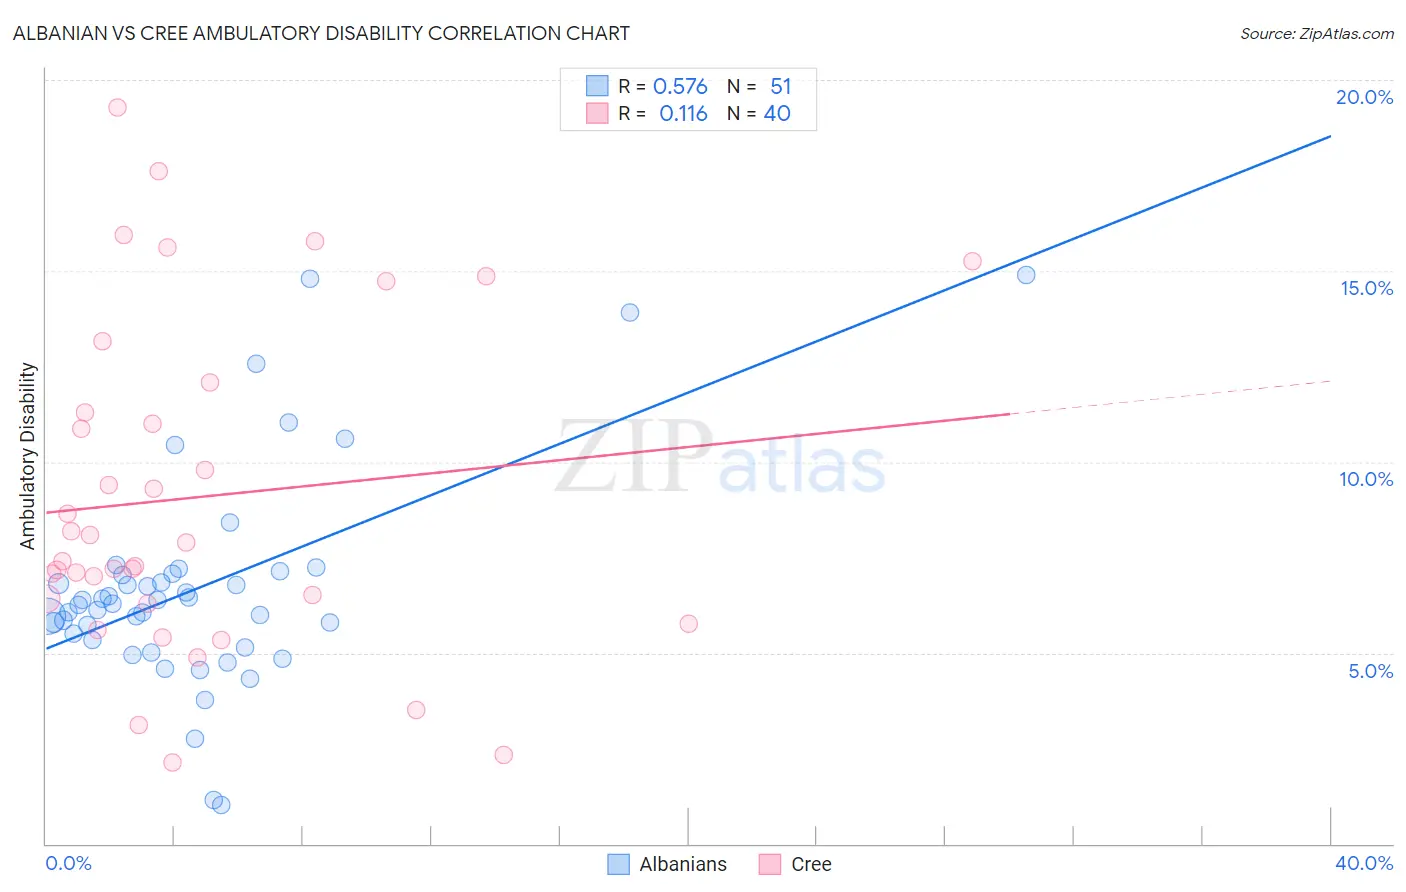
Albanian vs Cree Ambulatory Disability Correlation Chart
The statistical analysis conducted on geographies consisting of 193,248,883 people shows a substantial positive correlation between the proportion of Albanians and percentage of population with ambulatory disability in the United States with a correlation coefficient (R) of 0.576 and weighted average of 6.2%. Similarly, the statistical analysis conducted on geographies consisting of 76,208,414 people shows a poor positive correlation between the proportion of Cree and percentage of population with ambulatory disability in the United States with a correlation coefficient (R) of 0.116 and weighted average of 7.1%, a difference of 14.0%.
Ambulatory Disability Correlation Summary
| Measurement | Albanian | Cree |
| Minimum | 1.0% | 2.1% |
| Maximum | 14.9% | 19.3% |
| Range | 13.9% | 17.2% |
| Mean | 6.7% | 9.1% |
| Median | 6.3% | 7.7% |
| Interquartile 25% (IQ1) | 5.3% | 6.4% |
| Interquartile 75% (IQ3) | 7.1% | 11.7% |
| Interquartile Range (IQR) | 1.7% | 5.3% |
| Standard Deviation (Sample) | 2.8% | 4.3% |
| Standard Deviation (Population) | 2.8% | 4.3% |
Similar Demographics by Ambulatory Disability
Demographics Similar to Albanians by Ambulatory Disability
In terms of ambulatory disability, the demographic groups most similar to Albanians are Immigrants from Central America (6.2%, a difference of 0.030%), Immigrants from Ukraine (6.2%, a difference of 0.11%), Immigrants from Congo (6.2%, a difference of 0.13%), Immigrants from Cambodia (6.2%, a difference of 0.14%), and Slovene (6.2%, a difference of 0.15%).
| Demographics | Rating | Rank | Ambulatory Disability |
| Belgians | 28.6 /100 | #195 | Fair 6.2% |
| Malaysians | 28.2 /100 | #196 | Fair 6.2% |
| Poles | 26.3 /100 | #197 | Fair 6.2% |
| Immigrants | Bangladesh | 24.6 /100 | #198 | Fair 6.2% |
| Italians | 22.6 /100 | #199 | Fair 6.2% |
| Immigrants | Cambodia | 21.5 /100 | #200 | Fair 6.2% |
| Immigrants | Central America | 20.1 /100 | #201 | Fair 6.2% |
| Albanians | 19.7 /100 | #202 | Poor 6.2% |
| Immigrants | Ukraine | 18.4 /100 | #203 | Poor 6.2% |
| Immigrants | Congo | 18.2 /100 | #204 | Poor 6.2% |
| Slovenes | 18.0 /100 | #205 | Poor 6.2% |
| Finns | 17.2 /100 | #206 | Poor 6.2% |
| Alsatians | 15.1 /100 | #207 | Poor 6.3% |
| Bangladeshis | 14.2 /100 | #208 | Poor 6.3% |
| Immigrants | Iraq | 14.0 /100 | #209 | Poor 6.3% |
Demographics Similar to Cree by Ambulatory Disability
In terms of ambulatory disability, the demographic groups most similar to Cree are Arapaho (7.1%, a difference of 0.010%), Delaware (7.1%, a difference of 0.22%), Immigrants from the Azores (7.1%, a difference of 0.29%), Immigrants from Yemen (7.1%, a difference of 0.35%), and Blackfeet (7.1%, a difference of 0.38%).
| Demographics | Rating | Rank | Ambulatory Disability |
| Immigrants | Cabo Verde | 0.0 /100 | #304 | Tragic 7.0% |
| Immigrants | Micronesia | 0.0 /100 | #305 | Tragic 7.0% |
| Iroquois | 0.0 /100 | #306 | Tragic 7.1% |
| Spanish Americans | 0.0 /100 | #307 | Tragic 7.1% |
| Chippewa | 0.0 /100 | #308 | Tragic 7.1% |
| Immigrants | Azores | 0.0 /100 | #309 | Tragic 7.1% |
| Arapaho | 0.0 /100 | #310 | Tragic 7.1% |
| Cree | 0.0 /100 | #311 | Tragic 7.1% |
| Delaware | 0.0 /100 | #312 | Tragic 7.1% |
| Immigrants | Yemen | 0.0 /100 | #313 | Tragic 7.1% |
| Blackfeet | 0.0 /100 | #314 | Tragic 7.1% |
| Shoshone | 0.0 /100 | #315 | Tragic 7.1% |
| Immigrants | Dominican Republic | 0.0 /100 | #316 | Tragic 7.1% |
| Central American Indians | 0.0 /100 | #317 | Tragic 7.2% |
| Ottawa | 0.0 /100 | #318 | Tragic 7.2% |