Immigrants from Taiwan vs Cree Ambulatory Disability
COMPARE
Immigrants from Taiwan
Cree
Ambulatory Disability
Ambulatory Disability Comparison
Immigrants from Taiwan
Cree
4.9%
AMBULATORY DISABILITY
100.0/ 100
METRIC RATING
4th/ 347
METRIC RANK
7.1%
AMBULATORY DISABILITY
0.0/ 100
METRIC RATING
311th/ 347
METRIC RANK
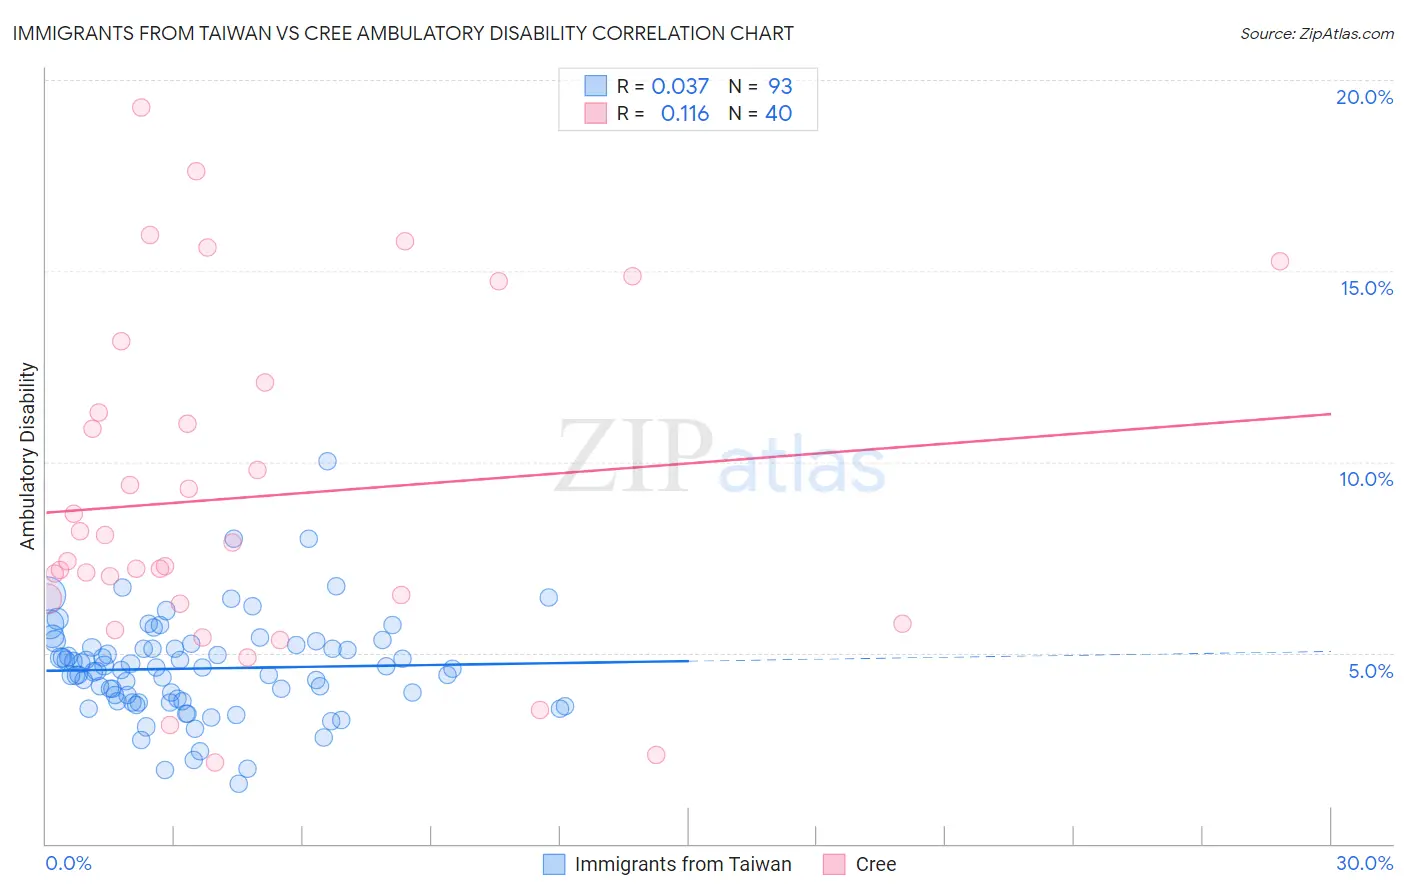
Immigrants from Taiwan vs Cree Ambulatory Disability Correlation Chart
The statistical analysis conducted on geographies consisting of 298,204,789 people shows no correlation between the proportion of Immigrants from Taiwan and percentage of population with ambulatory disability in the United States with a correlation coefficient (R) of 0.037 and weighted average of 4.9%. Similarly, the statistical analysis conducted on geographies consisting of 76,208,414 people shows a poor positive correlation between the proportion of Cree and percentage of population with ambulatory disability in the United States with a correlation coefficient (R) of 0.116 and weighted average of 7.1%, a difference of 43.9%.
Ambulatory Disability Correlation Summary
| Measurement | Immigrants from Taiwan | Cree |
| Minimum | 1.6% | 2.1% |
| Maximum | 10.0% | 19.3% |
| Range | 8.4% | 17.2% |
| Mean | 4.6% | 9.1% |
| Median | 4.6% | 7.7% |
| Interquartile 25% (IQ1) | 3.7% | 6.4% |
| Interquartile 75% (IQ3) | 5.2% | 11.7% |
| Interquartile Range (IQR) | 1.4% | 5.3% |
| Standard Deviation (Sample) | 1.3% | 4.3% |
| Standard Deviation (Population) | 1.3% | 4.3% |
Similar Demographics by Ambulatory Disability
Demographics Similar to Immigrants from Taiwan by Ambulatory Disability
In terms of ambulatory disability, the demographic groups most similar to Immigrants from Taiwan are Thai (4.9%, a difference of 0.24%), Immigrants from Singapore (5.0%, a difference of 1.4%), Filipino (4.9%, a difference of 1.4%), Immigrants from Bolivia (5.0%, a difference of 2.1%), and Bolivian (5.1%, a difference of 2.5%).
| Demographics | Rating | Rank | Ambulatory Disability |
| Immigrants | India | 100.0 /100 | #1 | Exceptional 4.8% |
| Filipinos | 100.0 /100 | #2 | Exceptional 4.9% |
| Thais | 100.0 /100 | #3 | Exceptional 4.9% |
| Immigrants | Taiwan | 100.0 /100 | #4 | Exceptional 4.9% |
| Immigrants | Singapore | 100.0 /100 | #5 | Exceptional 5.0% |
| Immigrants | Bolivia | 100.0 /100 | #6 | Exceptional 5.0% |
| Bolivians | 100.0 /100 | #7 | Exceptional 5.1% |
| Immigrants | South Central Asia | 100.0 /100 | #8 | Exceptional 5.1% |
| Iranians | 100.0 /100 | #9 | Exceptional 5.1% |
| Yup'ik | 100.0 /100 | #10 | Exceptional 5.2% |
| Immigrants | Korea | 100.0 /100 | #11 | Exceptional 5.2% |
| Okinawans | 100.0 /100 | #12 | Exceptional 5.3% |
| Burmese | 100.0 /100 | #13 | Exceptional 5.3% |
| Immigrants | Eastern Asia | 100.0 /100 | #14 | Exceptional 5.3% |
| Immigrants | China | 100.0 /100 | #15 | Exceptional 5.3% |
Demographics Similar to Cree by Ambulatory Disability
In terms of ambulatory disability, the demographic groups most similar to Cree are Arapaho (7.1%, a difference of 0.010%), Delaware (7.1%, a difference of 0.22%), Immigrants from the Azores (7.1%, a difference of 0.29%), Immigrants from Yemen (7.1%, a difference of 0.35%), and Blackfeet (7.1%, a difference of 0.38%).
| Demographics | Rating | Rank | Ambulatory Disability |
| Immigrants | Cabo Verde | 0.0 /100 | #304 | Tragic 7.0% |
| Immigrants | Micronesia | 0.0 /100 | #305 | Tragic 7.0% |
| Iroquois | 0.0 /100 | #306 | Tragic 7.1% |
| Spanish Americans | 0.0 /100 | #307 | Tragic 7.1% |
| Chippewa | 0.0 /100 | #308 | Tragic 7.1% |
| Immigrants | Azores | 0.0 /100 | #309 | Tragic 7.1% |
| Arapaho | 0.0 /100 | #310 | Tragic 7.1% |
| Cree | 0.0 /100 | #311 | Tragic 7.1% |
| Delaware | 0.0 /100 | #312 | Tragic 7.1% |
| Immigrants | Yemen | 0.0 /100 | #313 | Tragic 7.1% |
| Blackfeet | 0.0 /100 | #314 | Tragic 7.1% |
| Shoshone | 0.0 /100 | #315 | Tragic 7.1% |
| Immigrants | Dominican Republic | 0.0 /100 | #316 | Tragic 7.1% |
| Central American Indians | 0.0 /100 | #317 | Tragic 7.2% |
| Ottawa | 0.0 /100 | #318 | Tragic 7.2% |