Celtic vs Comanche No Vehicles in Household
COMPARE
Celtic
Comanche
No Vehicles in Household
No Vehicles in Household Comparison
Celtics
Comanche
8.1%
NO VEHICLES IN HOUSEHOLD
99.9/ 100
METRIC RATING
55th/ 347
METRIC RANK
10.2%
NO VEHICLES IN HOUSEHOLD
60.8/ 100
METRIC RATING
165th/ 347
METRIC RANK
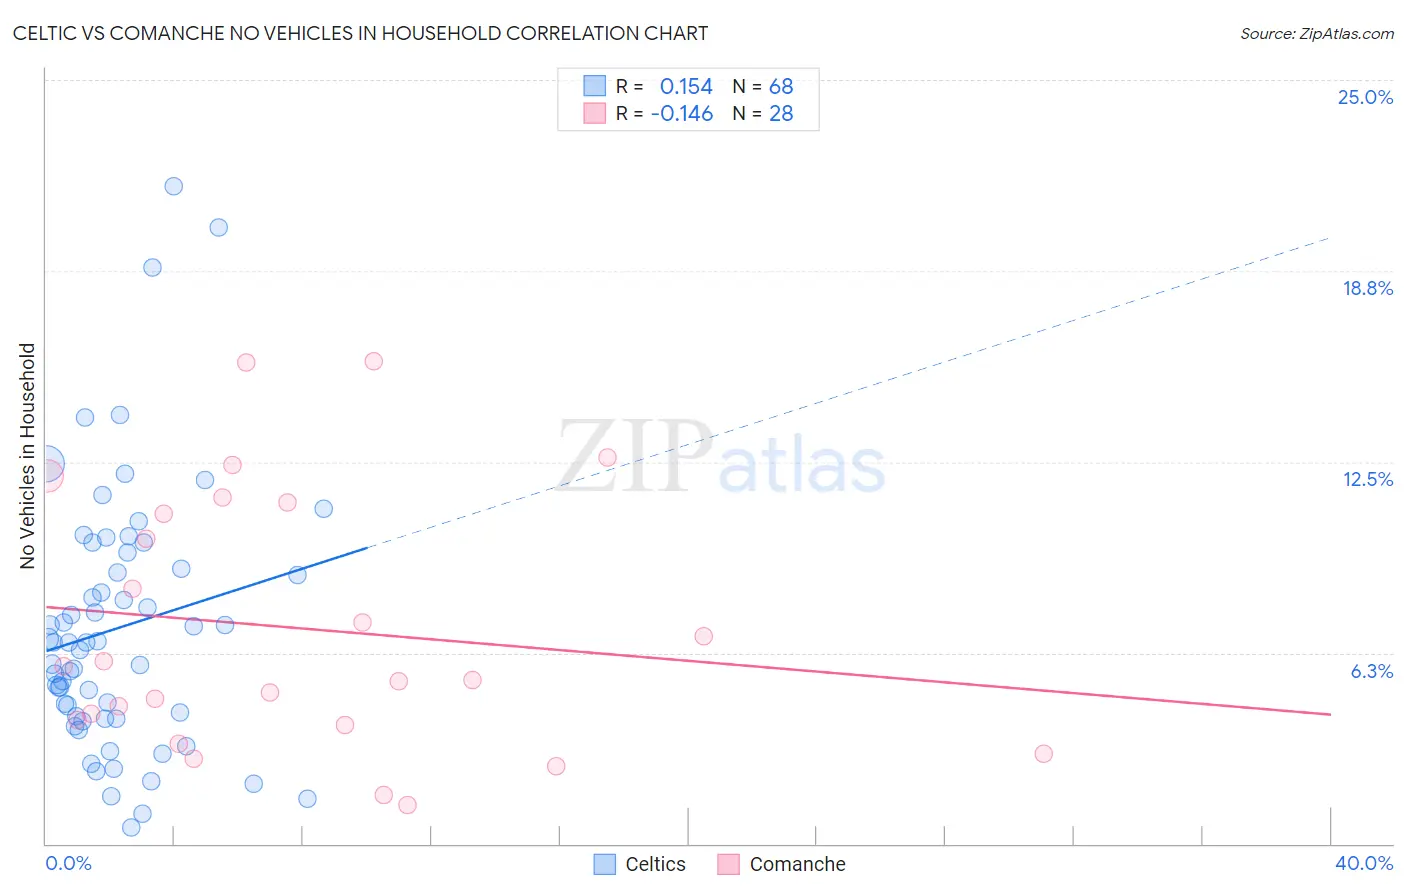
Celtic vs Comanche No Vehicles in Household Correlation Chart
The statistical analysis conducted on geographies consisting of 168,703,210 people shows a poor positive correlation between the proportion of Celtics and percentage of households with no vehicle available in the United States with a correlation coefficient (R) of 0.154 and weighted average of 8.1%. Similarly, the statistical analysis conducted on geographies consisting of 109,677,271 people shows a poor negative correlation between the proportion of Comanche and percentage of households with no vehicle available in the United States with a correlation coefficient (R) of -0.146 and weighted average of 10.2%, a difference of 27.0%.
No Vehicles in Household Correlation Summary
| Measurement | Celtic | Comanche |
| Minimum | 0.51% | 1.3% |
| Maximum | 21.5% | 15.8% |
| Range | 21.0% | 14.5% |
| Mean | 7.1% | 7.1% |
| Median | 6.6% | 5.6% |
| Interquartile 25% (IQ1) | 4.1% | 4.0% |
| Interquartile 75% (IQ3) | 9.3% | 11.0% |
| Interquartile Range (IQR) | 5.1% | 7.0% |
| Standard Deviation (Sample) | 4.3% | 4.2% |
| Standard Deviation (Population) | 4.2% | 4.1% |
Similar Demographics by No Vehicles in Household
Demographics Similar to Celtics by No Vehicles in Household
In terms of no vehicles in household, the demographic groups most similar to Celtics are Immigrants from Venezuela (8.1%, a difference of 0.090%), Immigrants from Afghanistan (8.1%, a difference of 0.39%), Hawaiian (8.0%, a difference of 0.40%), Slovene (8.0%, a difference of 0.40%), and Venezuelan (8.1%, a difference of 0.68%).
| Demographics | Rating | Rank | No Vehicles in Household |
| Afghans | 99.9 /100 | #48 | Exceptional 8.0% |
| Guamanians/Chamorros | 99.9 /100 | #49 | Exceptional 8.0% |
| Belgians | 99.9 /100 | #50 | Exceptional 8.0% |
| Koreans | 99.9 /100 | #51 | Exceptional 8.0% |
| Hawaiians | 99.9 /100 | #52 | Exceptional 8.0% |
| Slovenes | 99.9 /100 | #53 | Exceptional 8.0% |
| Immigrants | Venezuela | 99.9 /100 | #54 | Exceptional 8.1% |
| Celtics | 99.9 /100 | #55 | Exceptional 8.1% |
| Immigrants | Afghanistan | 99.9 /100 | #56 | Exceptional 8.1% |
| Venezuelans | 99.8 /100 | #57 | Exceptional 8.1% |
| Immigrants | Mexico | 99.8 /100 | #58 | Exceptional 8.1% |
| Immigrants | India | 99.8 /100 | #59 | Exceptional 8.2% |
| Immigrants | Laos | 99.8 /100 | #60 | Exceptional 8.2% |
| Thais | 99.8 /100 | #61 | Exceptional 8.2% |
| Chinese | 99.8 /100 | #62 | Exceptional 8.2% |
Demographics Similar to Comanche by No Vehicles in Household
In terms of no vehicles in household, the demographic groups most similar to Comanche are South African (10.2%, a difference of 0.040%), Immigrants from Costa Rica (10.3%, a difference of 0.050%), Immigrants from Saudi Arabia (10.3%, a difference of 0.30%), Immigrants from Cambodia (10.2%, a difference of 0.42%), and Immigrants from Austria (10.2%, a difference of 0.52%).
| Demographics | Rating | Rank | No Vehicles in Household |
| Spanish American Indians | 70.2 /100 | #158 | Good 10.1% |
| Immigrants | Indonesia | 69.3 /100 | #159 | Good 10.1% |
| Immigrants | Middle Africa | 65.7 /100 | #160 | Good 10.2% |
| New Zealanders | 65.1 /100 | #161 | Good 10.2% |
| Immigrants | Austria | 64.4 /100 | #162 | Good 10.2% |
| Immigrants | Cambodia | 63.7 /100 | #163 | Good 10.2% |
| South Africans | 61.1 /100 | #164 | Good 10.2% |
| Comanche | 60.8 /100 | #165 | Good 10.2% |
| Immigrants | Costa Rica | 60.5 /100 | #166 | Good 10.3% |
| Immigrants | Saudi Arabia | 58.8 /100 | #167 | Average 10.3% |
| Indonesians | 56.7 /100 | #168 | Average 10.3% |
| Lumbee | 54.7 /100 | #169 | Average 10.3% |
| Immigrants | Latin America | 53.2 /100 | #170 | Average 10.4% |
| Hmong | 52.7 /100 | #171 | Average 10.4% |
| Brazilians | 51.7 /100 | #172 | Average 10.4% |