Celtic vs Central American Indian Divorced or Separated
COMPARE
Celtic
Central American Indian
Divorced or Separated
Divorced or Separated Comparison
Celtics
Central American Indians
13.0%
DIVORCED OR SEPARATED
0.0/ 100
METRIC RATING
295th/ 347
METRIC RANK
12.7%
DIVORCED OR SEPARATED
0.3/ 100
METRIC RATING
275th/ 347
METRIC RANK
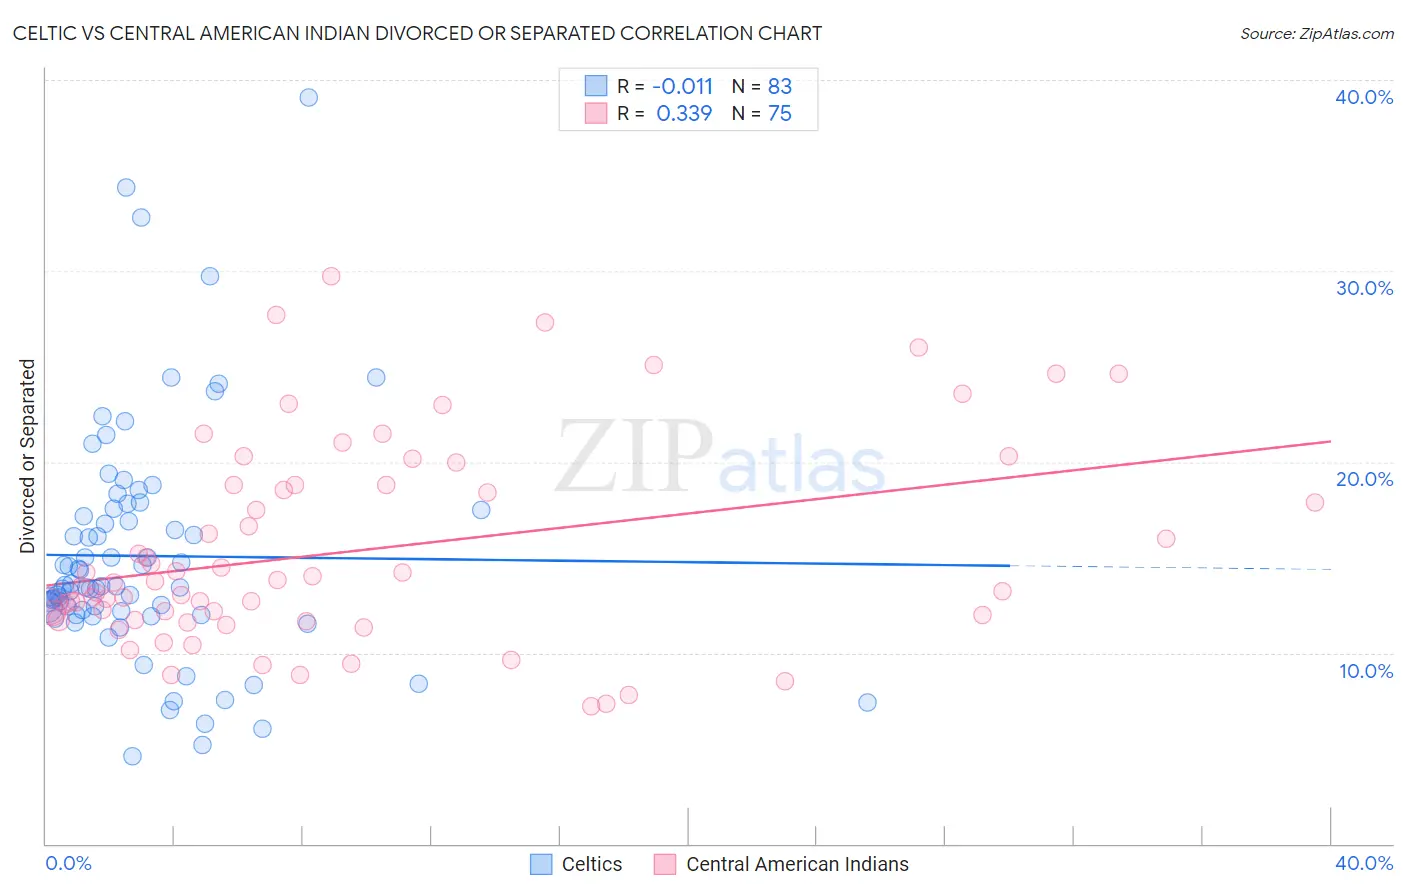
Celtic vs Central American Indian Divorced or Separated Correlation Chart
The statistical analysis conducted on geographies consisting of 168,870,662 people shows no correlation between the proportion of Celtics and percentage of population currently divorced or separated in the United States with a correlation coefficient (R) of -0.011 and weighted average of 13.0%. Similarly, the statistical analysis conducted on geographies consisting of 326,087,171 people shows a mild positive correlation between the proportion of Central American Indians and percentage of population currently divorced or separated in the United States with a correlation coefficient (R) of 0.339 and weighted average of 12.7%, a difference of 2.2%.
Divorced or Separated Correlation Summary
| Measurement | Celtic | Central American Indian |
| Minimum | 4.6% | 7.2% |
| Maximum | 39.1% | 29.7% |
| Range | 34.5% | 22.5% |
| Mean | 15.1% | 15.3% |
| Median | 13.5% | 13.7% |
| Interquartile 25% (IQ1) | 12.0% | 11.7% |
| Interquartile 75% (IQ3) | 17.5% | 18.8% |
| Interquartile Range (IQR) | 5.5% | 7.1% |
| Standard Deviation (Sample) | 6.1% | 5.3% |
| Standard Deviation (Population) | 6.1% | 5.3% |
Demographics Similar to Celtics and Central American Indians by Divorced or Separated
In terms of divorced or separated, the demographic groups most similar to Celtics are Apache (12.9%, a difference of 0.13%), Jamaican (12.9%, a difference of 0.16%), Scotch-Irish (12.9%, a difference of 0.37%), Immigrants from Honduras (12.9%, a difference of 0.42%), and Pima (12.9%, a difference of 0.54%). Similarly, the demographic groups most similar to Central American Indians are Spaniard (12.7%, a difference of 0.060%), Dominican (12.7%, a difference of 0.11%), Lumbee (12.7%, a difference of 0.27%), Immigrants from Dominican Republic (12.7%, a difference of 0.28%), and Immigrants from Zaire (12.7%, a difference of 0.35%).
| Demographics | Rating | Rank | Divorced or Separated |
| Central American Indians | 0.3 /100 | #275 | Tragic 12.7% |
| Spaniards | 0.2 /100 | #276 | Tragic 12.7% |
| Dominicans | 0.2 /100 | #277 | Tragic 12.7% |
| Lumbee | 0.2 /100 | #278 | Tragic 12.7% |
| Immigrants | Dominican Republic | 0.2 /100 | #279 | Tragic 12.7% |
| Immigrants | Zaire | 0.2 /100 | #280 | Tragic 12.7% |
| Pueblo | 0.2 /100 | #281 | Tragic 12.7% |
| Sub-Saharan Africans | 0.1 /100 | #282 | Tragic 12.7% |
| Delaware | 0.1 /100 | #283 | Tragic 12.7% |
| Immigrants | Nonimmigrants | 0.1 /100 | #284 | Tragic 12.8% |
| French | 0.1 /100 | #285 | Tragic 12.8% |
| Spanish | 0.1 /100 | #286 | Tragic 12.8% |
| Hondurans | 0.1 /100 | #287 | Tragic 12.8% |
| French Canadians | 0.1 /100 | #288 | Tragic 12.8% |
| Iroquois | 0.0 /100 | #289 | Tragic 12.9% |
| Pima | 0.0 /100 | #290 | Tragic 12.9% |
| Immigrants | Honduras | 0.0 /100 | #291 | Tragic 12.9% |
| Scotch-Irish | 0.0 /100 | #292 | Tragic 12.9% |
| Jamaicans | 0.0 /100 | #293 | Tragic 12.9% |
| Apache | 0.0 /100 | #294 | Tragic 12.9% |
| Celtics | 0.0 /100 | #295 | Tragic 13.0% |