Celtic vs Haitian Hearing Disability
COMPARE
Celtic
Haitian
Hearing Disability
Hearing Disability Comparison
Celtics
Haitians
3.7%
HEARING DISABILITY
0.0/ 100
METRIC RATING
298th/ 347
METRIC RANK
2.6%
HEARING DISABILITY
99.5/ 100
METRIC RATING
40th/ 347
METRIC RANK
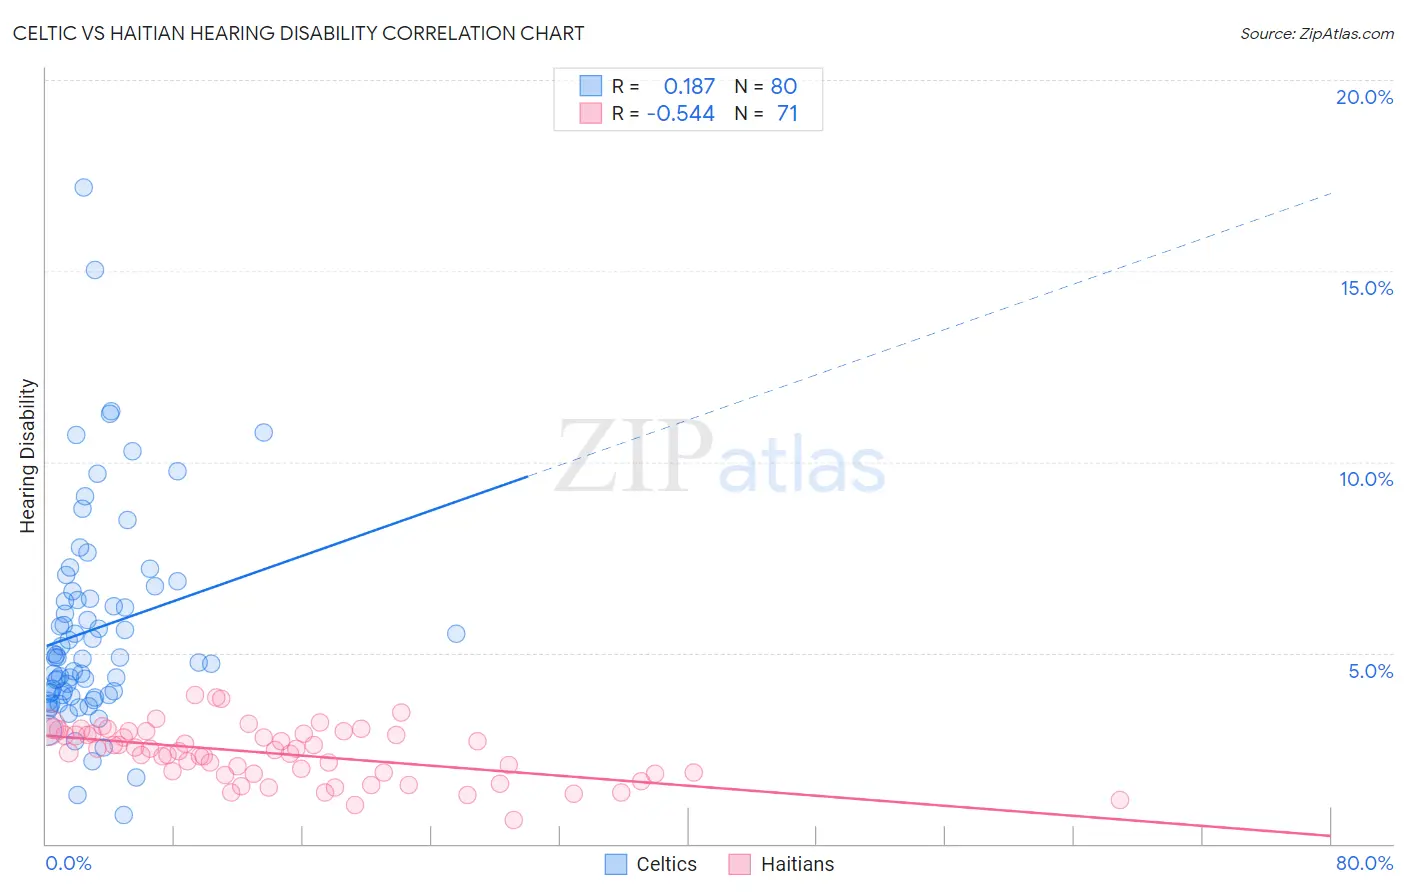
Celtic vs Haitian Hearing Disability Correlation Chart
The statistical analysis conducted on geographies consisting of 168,857,428 people shows a poor positive correlation between the proportion of Celtics and percentage of population with hearing disability in the United States with a correlation coefficient (R) of 0.187 and weighted average of 3.7%. Similarly, the statistical analysis conducted on geographies consisting of 287,794,704 people shows a substantial negative correlation between the proportion of Haitians and percentage of population with hearing disability in the United States with a correlation coefficient (R) of -0.544 and weighted average of 2.6%, a difference of 41.8%.
Hearing Disability Correlation Summary
| Measurement | Celtic | Haitian |
| Minimum | 0.76% | 0.62% |
| Maximum | 17.2% | 3.9% |
| Range | 16.4% | 3.3% |
| Mean | 5.6% | 2.4% |
| Median | 4.9% | 2.5% |
| Interquartile 25% (IQ1) | 3.9% | 1.8% |
| Interquartile 75% (IQ3) | 6.5% | 2.9% |
| Interquartile Range (IQR) | 2.6% | 1.0% |
| Standard Deviation (Sample) | 2.8% | 0.71% |
| Standard Deviation (Population) | 2.8% | 0.70% |
Similar Demographics by Hearing Disability
Demographics Similar to Celtics by Hearing Disability
In terms of hearing disability, the demographic groups most similar to Celtics are Immigrants from the Azores (3.7%, a difference of 0.19%), Pima (3.7%, a difference of 0.26%), German (3.7%, a difference of 0.28%), Scottish (3.7%, a difference of 0.34%), and Pennsylvania German (3.7%, a difference of 0.37%).
| Demographics | Rating | Rank | Hearing Disability |
| Finns | 0.0 /100 | #291 | Tragic 3.7% |
| Native Hawaiians | 0.0 /100 | #292 | Tragic 3.7% |
| Norwegians | 0.0 /100 | #293 | Tragic 3.7% |
| Iroquois | 0.0 /100 | #294 | Tragic 3.7% |
| Welsh | 0.0 /100 | #295 | Tragic 3.7% |
| Pima | 0.0 /100 | #296 | Tragic 3.7% |
| Immigrants | Azores | 0.0 /100 | #297 | Tragic 3.7% |
| Celtics | 0.0 /100 | #298 | Tragic 3.7% |
| Germans | 0.0 /100 | #299 | Tragic 3.7% |
| Scottish | 0.0 /100 | #300 | Tragic 3.7% |
| Pennsylvania Germans | 0.0 /100 | #301 | Tragic 3.7% |
| Dutch | 0.0 /100 | #302 | Tragic 3.7% |
| Menominee | 0.0 /100 | #303 | Tragic 3.7% |
| French | 0.0 /100 | #304 | Tragic 3.8% |
| English | 0.0 /100 | #305 | Tragic 3.8% |
Demographics Similar to Haitians by Hearing Disability
In terms of hearing disability, the demographic groups most similar to Haitians are Immigrants from China (2.6%, a difference of 0.080%), Immigrants from Jamaica (2.6%, a difference of 0.32%), Immigrants from Taiwan (2.6%, a difference of 0.34%), West Indian (2.6%, a difference of 0.34%), and Senegalese (2.6%, a difference of 0.35%).
| Demographics | Rating | Rank | Hearing Disability |
| Filipinos | 99.6 /100 | #33 | Exceptional 2.6% |
| Immigrants | Pakistan | 99.6 /100 | #34 | Exceptional 2.6% |
| Salvadorans | 99.6 /100 | #35 | Exceptional 2.6% |
| Okinawans | 99.6 /100 | #36 | Exceptional 2.6% |
| Immigrants | Western Africa | 99.6 /100 | #37 | Exceptional 2.6% |
| Immigrants | Jamaica | 99.5 /100 | #38 | Exceptional 2.6% |
| Immigrants | China | 99.5 /100 | #39 | Exceptional 2.6% |
| Haitians | 99.5 /100 | #40 | Exceptional 2.6% |
| Immigrants | Taiwan | 99.4 /100 | #41 | Exceptional 2.6% |
| West Indians | 99.4 /100 | #42 | Exceptional 2.6% |
| Senegalese | 99.4 /100 | #43 | Exceptional 2.6% |
| Nigerians | 99.4 /100 | #44 | Exceptional 2.6% |
| Venezuelans | 99.4 /100 | #45 | Exceptional 2.6% |
| Immigrants | Dominica | 99.3 /100 | #46 | Exceptional 2.6% |
| Immigrants | Israel | 99.3 /100 | #47 | Exceptional 2.6% |