Celtic vs Blackfeet Hearing Disability
COMPARE
Celtic
Blackfeet
Hearing Disability
Hearing Disability Comparison
Celtics
Blackfeet
3.7%
HEARING DISABILITY
0.0/ 100
METRIC RATING
298th/ 347
METRIC RANK
3.6%
HEARING DISABILITY
0.0/ 100
METRIC RATING
283rd/ 347
METRIC RANK
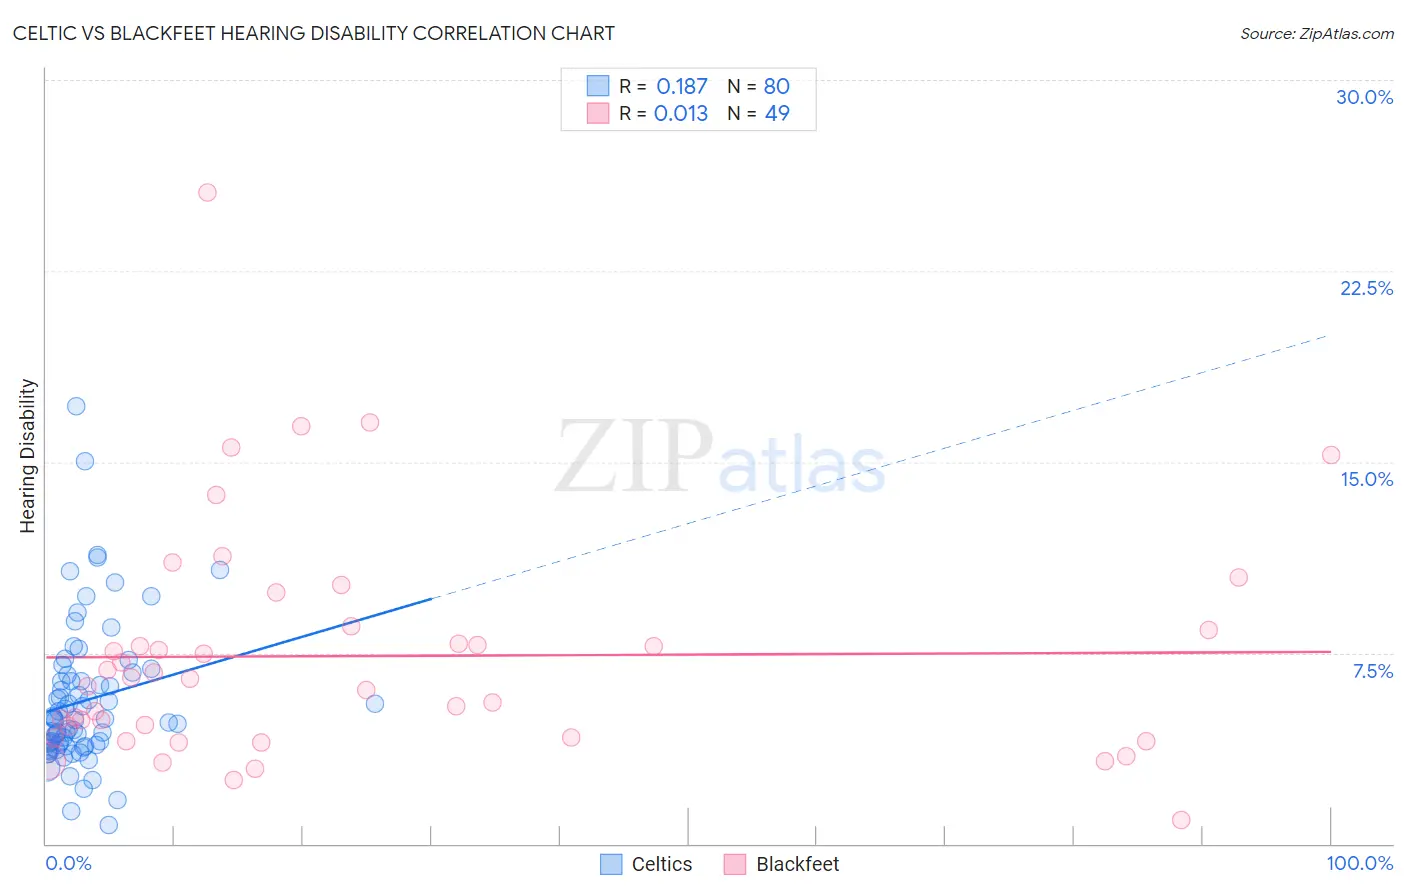
Celtic vs Blackfeet Hearing Disability Correlation Chart
The statistical analysis conducted on geographies consisting of 168,857,428 people shows a poor positive correlation between the proportion of Celtics and percentage of population with hearing disability in the United States with a correlation coefficient (R) of 0.187 and weighted average of 3.7%. Similarly, the statistical analysis conducted on geographies consisting of 309,445,553 people shows no correlation between the proportion of Blackfeet and percentage of population with hearing disability in the United States with a correlation coefficient (R) of 0.013 and weighted average of 3.6%, a difference of 2.8%.
Hearing Disability Correlation Summary
| Measurement | Celtic | Blackfeet |
| Minimum | 0.76% | 0.91% |
| Maximum | 17.2% | 25.6% |
| Range | 16.4% | 24.7% |
| Mean | 5.6% | 7.4% |
| Median | 4.9% | 6.5% |
| Interquartile 25% (IQ1) | 3.9% | 4.2% |
| Interquartile 75% (IQ3) | 6.5% | 8.5% |
| Interquartile Range (IQR) | 2.6% | 4.3% |
| Standard Deviation (Sample) | 2.8% | 4.6% |
| Standard Deviation (Population) | 2.8% | 4.5% |
Demographics Similar to Celtics and Blackfeet by Hearing Disability
In terms of hearing disability, the demographic groups most similar to Celtics are Immigrants from the Azores (3.7%, a difference of 0.19%), Pima (3.7%, a difference of 0.26%), German (3.7%, a difference of 0.28%), Scottish (3.7%, a difference of 0.34%), and Welsh (3.7%, a difference of 0.39%). Similarly, the demographic groups most similar to Blackfeet are Swedish (3.6%, a difference of 0.25%), Scandinavian (3.6%, a difference of 0.34%), French American Indian (3.6%, a difference of 0.40%), Immigrants from Micronesia (3.6%, a difference of 0.47%), and Sioux (3.6%, a difference of 0.57%).
| Demographics | Rating | Rank | Hearing Disability |
| French American Indians | 0.0 /100 | #280 | Tragic 3.6% |
| Scandinavians | 0.0 /100 | #281 | Tragic 3.6% |
| Swedes | 0.0 /100 | #282 | Tragic 3.6% |
| Blackfeet | 0.0 /100 | #283 | Tragic 3.6% |
| Immigrants | Micronesia | 0.0 /100 | #284 | Tragic 3.6% |
| Sioux | 0.0 /100 | #285 | Tragic 3.6% |
| Delaware | 0.0 /100 | #286 | Tragic 3.6% |
| Spanish | 0.0 /100 | #287 | Tragic 3.7% |
| Irish | 0.0 /100 | #288 | Tragic 3.7% |
| Chinese | 0.0 /100 | #289 | Tragic 3.7% |
| Whites/Caucasians | 0.0 /100 | #290 | Tragic 3.7% |
| Finns | 0.0 /100 | #291 | Tragic 3.7% |
| Native Hawaiians | 0.0 /100 | #292 | Tragic 3.7% |
| Norwegians | 0.0 /100 | #293 | Tragic 3.7% |
| Iroquois | 0.0 /100 | #294 | Tragic 3.7% |
| Welsh | 0.0 /100 | #295 | Tragic 3.7% |
| Pima | 0.0 /100 | #296 | Tragic 3.7% |
| Immigrants | Azores | 0.0 /100 | #297 | Tragic 3.7% |
| Celtics | 0.0 /100 | #298 | Tragic 3.7% |
| Germans | 0.0 /100 | #299 | Tragic 3.7% |
| Scottish | 0.0 /100 | #300 | Tragic 3.7% |