Hungarian vs Immigrants from Switzerland Ambulatory Disability
COMPARE
Hungarian
Immigrants from Switzerland
Ambulatory Disability
Ambulatory Disability Comparison
Hungarians
Immigrants from Switzerland
6.3%
AMBULATORY DISABILITY
9.6/ 100
METRIC RATING
221st/ 347
METRIC RANK
5.7%
AMBULATORY DISABILITY
99.7/ 100
METRIC RATING
65th/ 347
METRIC RANK
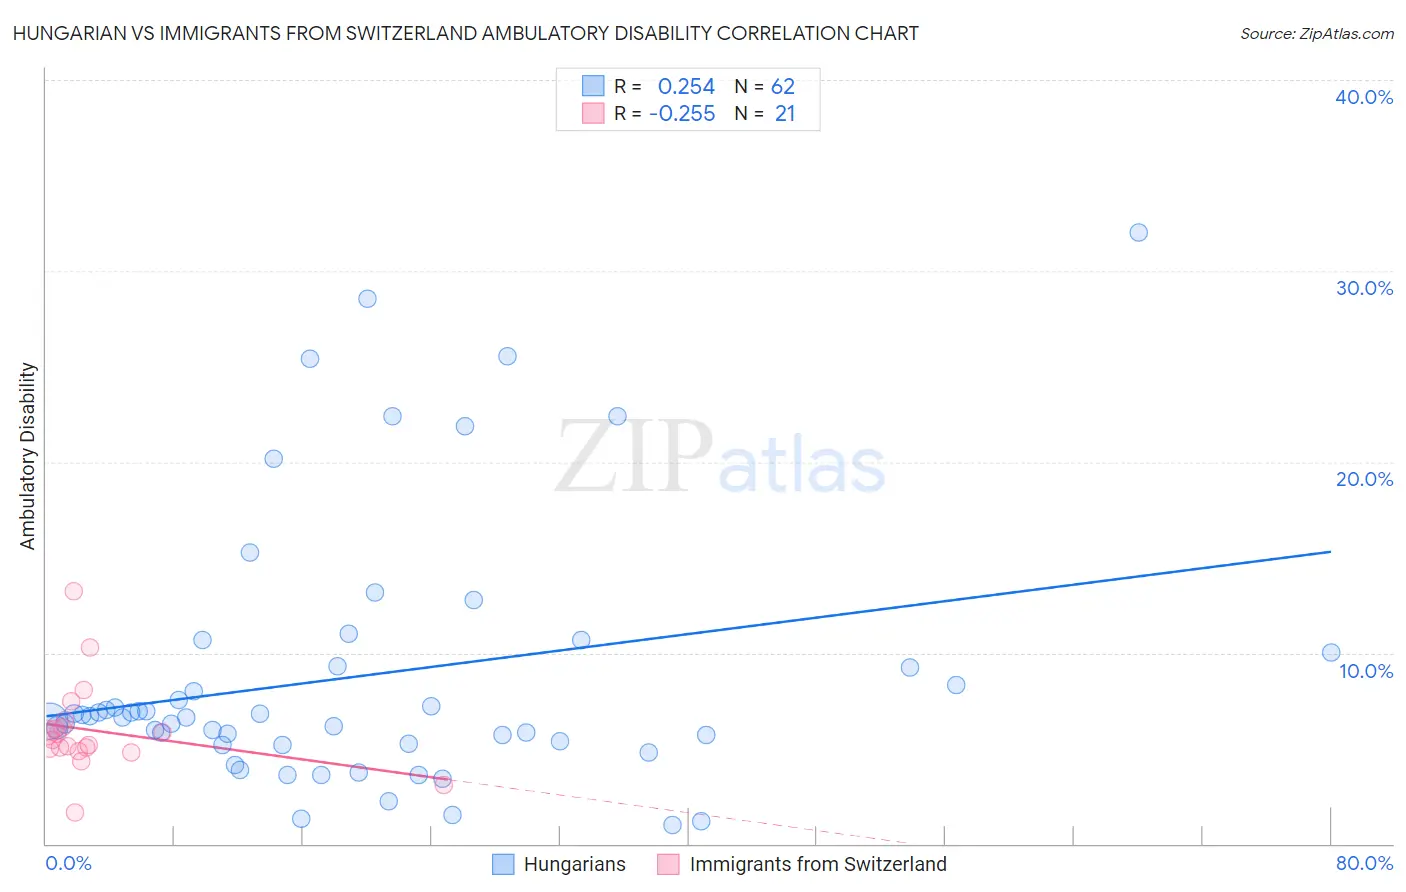
Hungarian vs Immigrants from Switzerland Ambulatory Disability Correlation Chart
The statistical analysis conducted on geographies consisting of 486,018,761 people shows a weak positive correlation between the proportion of Hungarians and percentage of population with ambulatory disability in the United States with a correlation coefficient (R) of 0.254 and weighted average of 6.3%. Similarly, the statistical analysis conducted on geographies consisting of 148,074,986 people shows a weak negative correlation between the proportion of Immigrants from Switzerland and percentage of population with ambulatory disability in the United States with a correlation coefficient (R) of -0.255 and weighted average of 5.7%, a difference of 11.4%.
Ambulatory Disability Correlation Summary
| Measurement | Hungarian | Immigrants from Switzerland |
| Minimum | 1.0% | 1.6% |
| Maximum | 32.0% | 13.2% |
| Range | 31.0% | 11.6% |
| Mean | 8.8% | 5.9% |
| Median | 6.7% | 5.4% |
| Interquartile 25% (IQ1) | 5.2% | 4.9% |
| Interquartile 75% (IQ3) | 9.3% | 6.3% |
| Interquartile Range (IQR) | 4.1% | 1.4% |
| Standard Deviation (Sample) | 6.9% | 2.4% |
| Standard Deviation (Population) | 6.8% | 2.3% |
Similar Demographics by Ambulatory Disability
Demographics Similar to Hungarians by Ambulatory Disability
In terms of ambulatory disability, the demographic groups most similar to Hungarians are Immigrants from Albania (6.3%, a difference of 0.010%), German Russian (6.3%, a difference of 0.030%), Indonesian (6.3%, a difference of 0.050%), Guamanian/Chamorro (6.3%, a difference of 0.14%), and Yugoslavian (6.3%, a difference of 0.18%).
| Demographics | Rating | Rank | Ambulatory Disability |
| Immigrants | Mexico | 11.0 /100 | #214 | Poor 6.3% |
| Immigrants | Latin America | 11.0 /100 | #215 | Poor 6.3% |
| Canadians | 10.9 /100 | #216 | Poor 6.3% |
| Yugoslavians | 10.9 /100 | #217 | Poor 6.3% |
| Guamanians/Chamorros | 10.6 /100 | #218 | Poor 6.3% |
| Indonesians | 9.9 /100 | #219 | Tragic 6.3% |
| Immigrants | Albania | 9.6 /100 | #220 | Tragic 6.3% |
| Hungarians | 9.6 /100 | #221 | Tragic 6.3% |
| German Russians | 9.4 /100 | #222 | Tragic 6.3% |
| Immigrants | Honduras | 7.6 /100 | #223 | Tragic 6.3% |
| Liberians | 7.1 /100 | #224 | Tragic 6.3% |
| Hondurans | 6.3 /100 | #225 | Tragic 6.3% |
| Slavs | 5.1 /100 | #226 | Tragic 6.4% |
| Cubans | 4.0 /100 | #227 | Tragic 6.4% |
| Portuguese | 4.0 /100 | #228 | Tragic 6.4% |
Demographics Similar to Immigrants from Switzerland by Ambulatory Disability
In terms of ambulatory disability, the demographic groups most similar to Immigrants from Switzerland are Laotian (5.7%, a difference of 0.030%), Israeli (5.7%, a difference of 0.090%), Immigrants from Uganda (5.7%, a difference of 0.11%), Sri Lankan (5.7%, a difference of 0.13%), and Immigrants from France (5.6%, a difference of 0.16%).
| Demographics | Rating | Rank | Ambulatory Disability |
| Immigrants | Zimbabwe | 99.8 /100 | #58 | Exceptional 5.6% |
| Immigrants | Afghanistan | 99.8 /100 | #59 | Exceptional 5.6% |
| Immigrants | Lithuania | 99.8 /100 | #60 | Exceptional 5.6% |
| Immigrants | Belgium | 99.7 /100 | #61 | Exceptional 5.6% |
| Immigrants | Spain | 99.7 /100 | #62 | Exceptional 5.6% |
| Immigrants | France | 99.7 /100 | #63 | Exceptional 5.6% |
| Laotians | 99.7 /100 | #64 | Exceptional 5.7% |
| Immigrants | Switzerland | 99.7 /100 | #65 | Exceptional 5.7% |
| Israelis | 99.6 /100 | #66 | Exceptional 5.7% |
| Immigrants | Uganda | 99.6 /100 | #67 | Exceptional 5.7% |
| Sri Lankans | 99.6 /100 | #68 | Exceptional 5.7% |
| Peruvians | 99.5 /100 | #69 | Exceptional 5.7% |
| Sierra Leoneans | 99.4 /100 | #70 | Exceptional 5.7% |
| Immigrants | Peru | 99.4 /100 | #71 | Exceptional 5.7% |
| Brazilians | 99.4 /100 | #72 | Exceptional 5.7% |