Luxembourger vs Immigrants from Switzerland Ambulatory Disability
COMPARE
Luxembourger
Immigrants from Switzerland
Ambulatory Disability
Ambulatory Disability Comparison
Luxembourgers
Immigrants from Switzerland
5.6%
AMBULATORY DISABILITY
99.9/ 100
METRIC RATING
50th/ 347
METRIC RANK
5.7%
AMBULATORY DISABILITY
99.7/ 100
METRIC RATING
65th/ 347
METRIC RANK
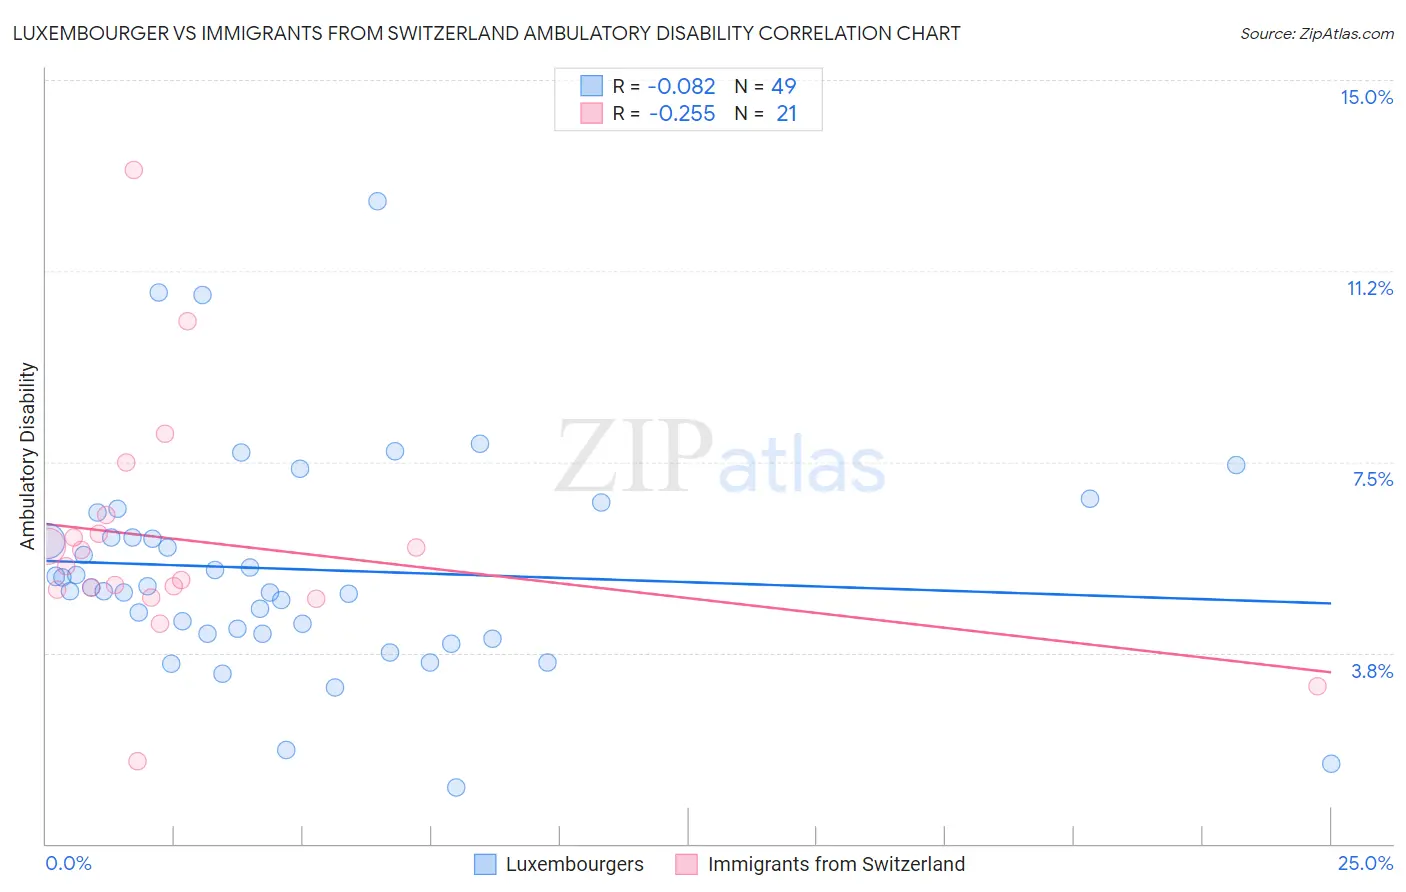
Luxembourger vs Immigrants from Switzerland Ambulatory Disability Correlation Chart
The statistical analysis conducted on geographies consisting of 144,679,340 people shows a slight negative correlation between the proportion of Luxembourgers and percentage of population with ambulatory disability in the United States with a correlation coefficient (R) of -0.082 and weighted average of 5.6%. Similarly, the statistical analysis conducted on geographies consisting of 148,074,986 people shows a weak negative correlation between the proportion of Immigrants from Switzerland and percentage of population with ambulatory disability in the United States with a correlation coefficient (R) of -0.255 and weighted average of 5.7%, a difference of 1.2%.
Ambulatory Disability Correlation Summary
| Measurement | Luxembourger | Immigrants from Switzerland |
| Minimum | 1.1% | 1.6% |
| Maximum | 12.6% | 13.2% |
| Range | 11.5% | 11.6% |
| Mean | 5.4% | 5.9% |
| Median | 5.0% | 5.4% |
| Interquartile 25% (IQ1) | 4.1% | 4.9% |
| Interquartile 75% (IQ3) | 6.3% | 6.3% |
| Interquartile Range (IQR) | 2.1% | 1.4% |
| Standard Deviation (Sample) | 2.2% | 2.4% |
| Standard Deviation (Population) | 2.1% | 2.3% |
Demographics Similar to Luxembourgers and Immigrants from Switzerland by Ambulatory Disability
In terms of ambulatory disability, the demographic groups most similar to Luxembourgers are Taiwanese (5.6%, a difference of 0.10%), Jordanian (5.6%, a difference of 0.19%), Immigrants from Egypt (5.6%, a difference of 0.20%), Immigrants from Eastern Africa (5.6%, a difference of 0.25%), and Immigrants from Bulgaria (5.6%, a difference of 0.31%). Similarly, the demographic groups most similar to Immigrants from Switzerland are Laotian (5.7%, a difference of 0.030%), Israeli (5.7%, a difference of 0.090%), Immigrants from Uganda (5.7%, a difference of 0.11%), Immigrants from France (5.6%, a difference of 0.16%), and Immigrants from Spain (5.6%, a difference of 0.28%).
| Demographics | Rating | Rank | Ambulatory Disability |
| Immigrants | Japan | 99.9 /100 | #47 | Exceptional 5.6% |
| Immigrants | Argentina | 99.9 /100 | #48 | Exceptional 5.6% |
| Bulgarians | 99.9 /100 | #49 | Exceptional 5.6% |
| Luxembourgers | 99.9 /100 | #50 | Exceptional 5.6% |
| Taiwanese | 99.8 /100 | #51 | Exceptional 5.6% |
| Jordanians | 99.8 /100 | #52 | Exceptional 5.6% |
| Immigrants | Egypt | 99.8 /100 | #53 | Exceptional 5.6% |
| Immigrants | Eastern Africa | 99.8 /100 | #54 | Exceptional 5.6% |
| Immigrants | Bulgaria | 99.8 /100 | #55 | Exceptional 5.6% |
| Inupiat | 99.8 /100 | #56 | Exceptional 5.6% |
| Immigrants | Brazil | 99.8 /100 | #57 | Exceptional 5.6% |
| Immigrants | Zimbabwe | 99.8 /100 | #58 | Exceptional 5.6% |
| Immigrants | Afghanistan | 99.8 /100 | #59 | Exceptional 5.6% |
| Immigrants | Lithuania | 99.8 /100 | #60 | Exceptional 5.6% |
| Immigrants | Belgium | 99.7 /100 | #61 | Exceptional 5.6% |
| Immigrants | Spain | 99.7 /100 | #62 | Exceptional 5.6% |
| Immigrants | France | 99.7 /100 | #63 | Exceptional 5.6% |
| Laotians | 99.7 /100 | #64 | Exceptional 5.7% |
| Immigrants | Switzerland | 99.7 /100 | #65 | Exceptional 5.7% |
| Israelis | 99.6 /100 | #66 | Exceptional 5.7% |
| Immigrants | Uganda | 99.6 /100 | #67 | Exceptional 5.7% |