Kenyan vs Immigrants from Switzerland Ambulatory Disability
COMPARE
Kenyan
Immigrants from Switzerland
Ambulatory Disability
Ambulatory Disability Comparison
Kenyans
Immigrants from Switzerland
5.8%
AMBULATORY DISABILITY
98.4/ 100
METRIC RATING
94th/ 347
METRIC RANK
5.7%
AMBULATORY DISABILITY
99.7/ 100
METRIC RATING
65th/ 347
METRIC RANK
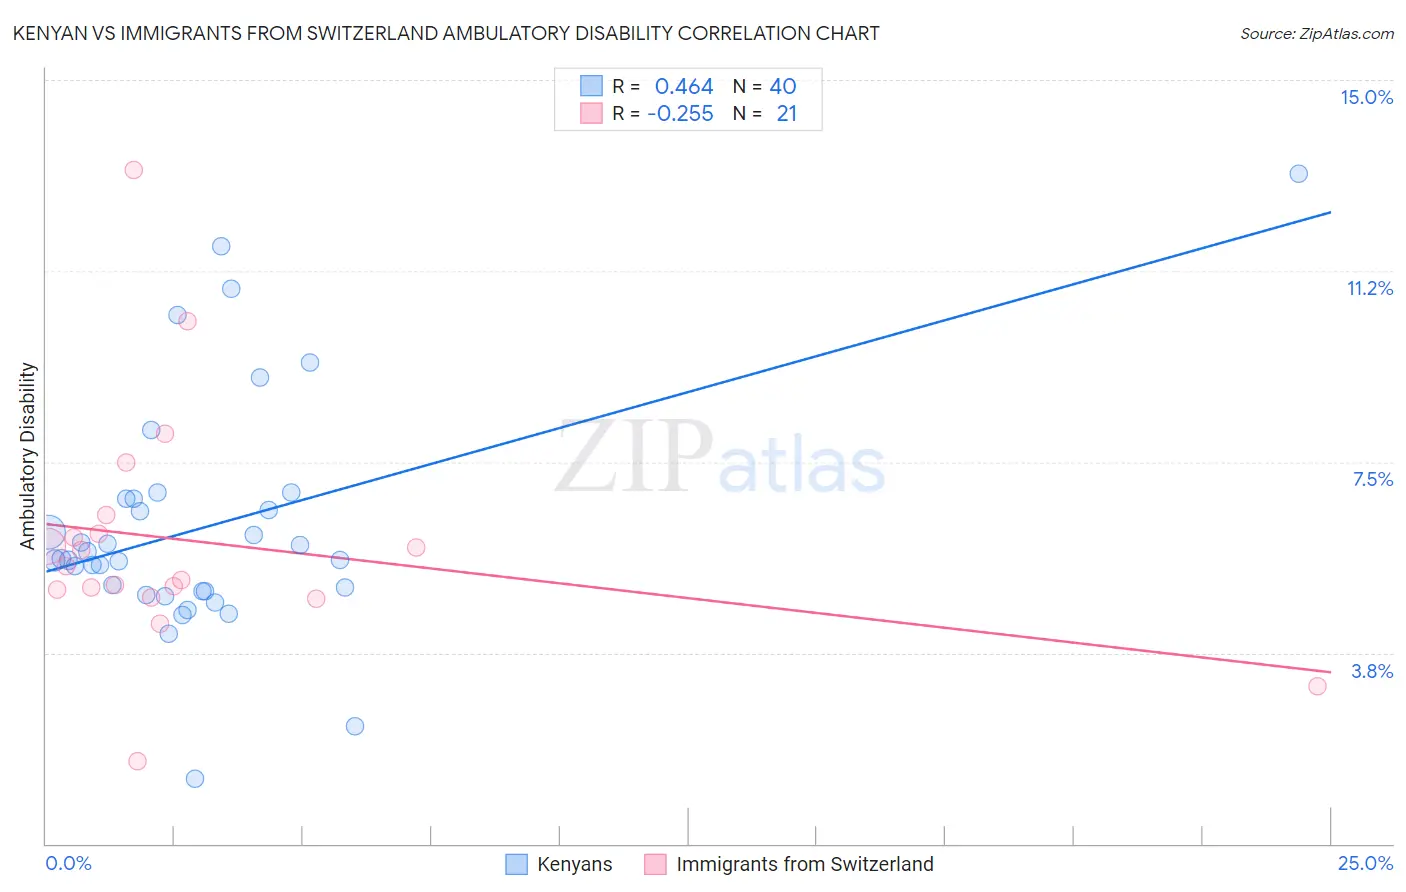
Kenyan vs Immigrants from Switzerland Ambulatory Disability Correlation Chart
The statistical analysis conducted on geographies consisting of 168,175,436 people shows a moderate positive correlation between the proportion of Kenyans and percentage of population with ambulatory disability in the United States with a correlation coefficient (R) of 0.464 and weighted average of 5.8%. Similarly, the statistical analysis conducted on geographies consisting of 148,074,986 people shows a weak negative correlation between the proportion of Immigrants from Switzerland and percentage of population with ambulatory disability in the United States with a correlation coefficient (R) of -0.255 and weighted average of 5.7%, a difference of 2.2%.
Ambulatory Disability Correlation Summary
| Measurement | Kenyan | Immigrants from Switzerland |
| Minimum | 1.3% | 1.6% |
| Maximum | 13.2% | 13.2% |
| Range | 11.9% | 11.6% |
| Mean | 6.2% | 5.9% |
| Median | 5.6% | 5.4% |
| Interquartile 25% (IQ1) | 5.0% | 4.9% |
| Interquartile 75% (IQ3) | 6.8% | 6.3% |
| Interquartile Range (IQR) | 1.8% | 1.4% |
| Standard Deviation (Sample) | 2.3% | 2.4% |
| Standard Deviation (Population) | 2.3% | 2.3% |
Similar Demographics by Ambulatory Disability
Demographics Similar to Kenyans by Ambulatory Disability
In terms of ambulatory disability, the demographic groups most similar to Kenyans are Immigrants from El Salvador (5.8%, a difference of 0.040%), Salvadoran (5.8%, a difference of 0.060%), Immigrants from Somalia (5.8%, a difference of 0.10%), Immigrants from Lebanon (5.8%, a difference of 0.12%), and Immigrants from Denmark (5.8%, a difference of 0.19%).
| Demographics | Rating | Rank | Ambulatory Disability |
| Immigrants | Chile | 98.9 /100 | #87 | Exceptional 5.8% |
| Soviet Union | 98.9 /100 | #88 | Exceptional 5.8% |
| Bhutanese | 98.8 /100 | #89 | Exceptional 5.8% |
| Australians | 98.8 /100 | #90 | Exceptional 5.8% |
| Immigrants | Sudan | 98.8 /100 | #91 | Exceptional 5.8% |
| Immigrants | Sierra Leone | 98.6 /100 | #92 | Exceptional 5.8% |
| Immigrants | Denmark | 98.6 /100 | #93 | Exceptional 5.8% |
| Kenyans | 98.4 /100 | #94 | Exceptional 5.8% |
| Immigrants | El Salvador | 98.4 /100 | #95 | Exceptional 5.8% |
| Salvadorans | 98.4 /100 | #96 | Exceptional 5.8% |
| Immigrants | Somalia | 98.3 /100 | #97 | Exceptional 5.8% |
| Immigrants | Lebanon | 98.3 /100 | #98 | Exceptional 5.8% |
| Immigrants | Northern Europe | 98.2 /100 | #99 | Exceptional 5.8% |
| Immigrants | Serbia | 97.9 /100 | #100 | Exceptional 5.8% |
| Immigrants | South America | 97.9 /100 | #101 | Exceptional 5.8% |
Demographics Similar to Immigrants from Switzerland by Ambulatory Disability
In terms of ambulatory disability, the demographic groups most similar to Immigrants from Switzerland are Laotian (5.7%, a difference of 0.030%), Israeli (5.7%, a difference of 0.090%), Immigrants from Uganda (5.7%, a difference of 0.11%), Sri Lankan (5.7%, a difference of 0.13%), and Immigrants from France (5.6%, a difference of 0.16%).
| Demographics | Rating | Rank | Ambulatory Disability |
| Immigrants | Zimbabwe | 99.8 /100 | #58 | Exceptional 5.6% |
| Immigrants | Afghanistan | 99.8 /100 | #59 | Exceptional 5.6% |
| Immigrants | Lithuania | 99.8 /100 | #60 | Exceptional 5.6% |
| Immigrants | Belgium | 99.7 /100 | #61 | Exceptional 5.6% |
| Immigrants | Spain | 99.7 /100 | #62 | Exceptional 5.6% |
| Immigrants | France | 99.7 /100 | #63 | Exceptional 5.6% |
| Laotians | 99.7 /100 | #64 | Exceptional 5.7% |
| Immigrants | Switzerland | 99.7 /100 | #65 | Exceptional 5.7% |
| Israelis | 99.6 /100 | #66 | Exceptional 5.7% |
| Immigrants | Uganda | 99.6 /100 | #67 | Exceptional 5.7% |
| Sri Lankans | 99.6 /100 | #68 | Exceptional 5.7% |
| Peruvians | 99.5 /100 | #69 | Exceptional 5.7% |
| Sierra Leoneans | 99.4 /100 | #70 | Exceptional 5.7% |
| Immigrants | Peru | 99.4 /100 | #71 | Exceptional 5.7% |
| Brazilians | 99.4 /100 | #72 | Exceptional 5.7% |