Albanian vs Immigrants from Switzerland Ambulatory Disability
COMPARE
Albanian
Immigrants from Switzerland
Ambulatory Disability
Ambulatory Disability Comparison
Albanians
Immigrants from Switzerland
6.2%
AMBULATORY DISABILITY
19.7/ 100
METRIC RATING
202nd/ 347
METRIC RANK
5.7%
AMBULATORY DISABILITY
99.7/ 100
METRIC RATING
65th/ 347
METRIC RANK
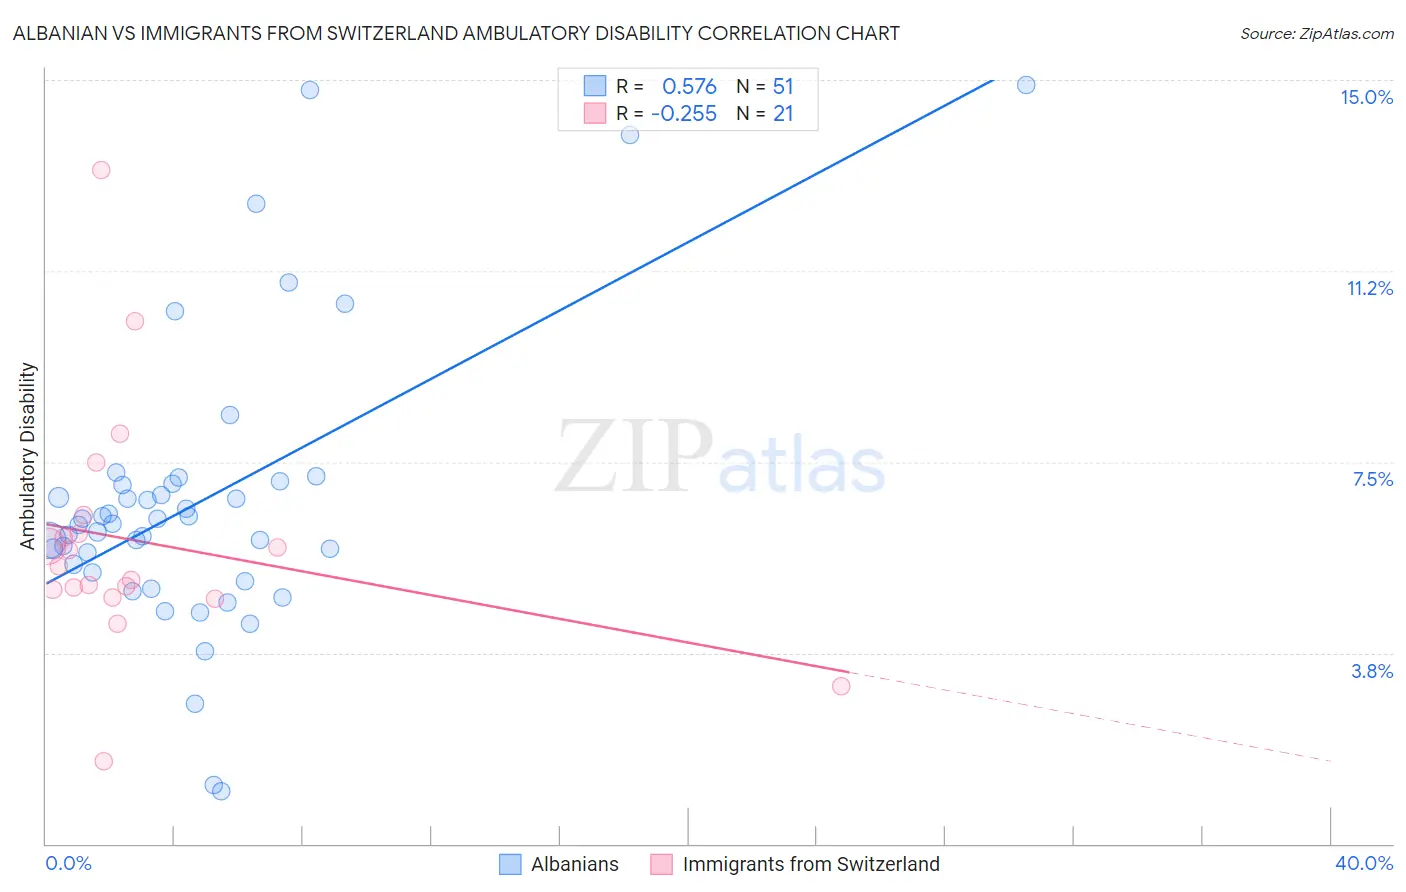
Albanian vs Immigrants from Switzerland Ambulatory Disability Correlation Chart
The statistical analysis conducted on geographies consisting of 193,248,883 people shows a substantial positive correlation between the proportion of Albanians and percentage of population with ambulatory disability in the United States with a correlation coefficient (R) of 0.576 and weighted average of 6.2%. Similarly, the statistical analysis conducted on geographies consisting of 148,074,986 people shows a weak negative correlation between the proportion of Immigrants from Switzerland and percentage of population with ambulatory disability in the United States with a correlation coefficient (R) of -0.255 and weighted average of 5.7%, a difference of 10.2%.
Ambulatory Disability Correlation Summary
| Measurement | Albanian | Immigrants from Switzerland |
| Minimum | 1.0% | 1.6% |
| Maximum | 14.9% | 13.2% |
| Range | 13.9% | 11.6% |
| Mean | 6.7% | 5.9% |
| Median | 6.3% | 5.4% |
| Interquartile 25% (IQ1) | 5.3% | 4.9% |
| Interquartile 75% (IQ3) | 7.1% | 6.3% |
| Interquartile Range (IQR) | 1.7% | 1.4% |
| Standard Deviation (Sample) | 2.8% | 2.4% |
| Standard Deviation (Population) | 2.8% | 2.3% |
Similar Demographics by Ambulatory Disability
Demographics Similar to Albanians by Ambulatory Disability
In terms of ambulatory disability, the demographic groups most similar to Albanians are Immigrants from Central America (6.2%, a difference of 0.030%), Immigrants from Ukraine (6.2%, a difference of 0.11%), Immigrants from Congo (6.2%, a difference of 0.13%), Immigrants from Cambodia (6.2%, a difference of 0.14%), and Slovene (6.2%, a difference of 0.15%).
| Demographics | Rating | Rank | Ambulatory Disability |
| Belgians | 28.6 /100 | #195 | Fair 6.2% |
| Malaysians | 28.2 /100 | #196 | Fair 6.2% |
| Poles | 26.3 /100 | #197 | Fair 6.2% |
| Immigrants | Bangladesh | 24.6 /100 | #198 | Fair 6.2% |
| Italians | 22.6 /100 | #199 | Fair 6.2% |
| Immigrants | Cambodia | 21.5 /100 | #200 | Fair 6.2% |
| Immigrants | Central America | 20.1 /100 | #201 | Fair 6.2% |
| Albanians | 19.7 /100 | #202 | Poor 6.2% |
| Immigrants | Ukraine | 18.4 /100 | #203 | Poor 6.2% |
| Immigrants | Congo | 18.2 /100 | #204 | Poor 6.2% |
| Slovenes | 18.0 /100 | #205 | Poor 6.2% |
| Finns | 17.2 /100 | #206 | Poor 6.2% |
| Alsatians | 15.1 /100 | #207 | Poor 6.3% |
| Bangladeshis | 14.2 /100 | #208 | Poor 6.3% |
| Immigrants | Iraq | 14.0 /100 | #209 | Poor 6.3% |
Demographics Similar to Immigrants from Switzerland by Ambulatory Disability
In terms of ambulatory disability, the demographic groups most similar to Immigrants from Switzerland are Laotian (5.7%, a difference of 0.030%), Israeli (5.7%, a difference of 0.090%), Immigrants from Uganda (5.7%, a difference of 0.11%), Sri Lankan (5.7%, a difference of 0.13%), and Immigrants from France (5.6%, a difference of 0.16%).
| Demographics | Rating | Rank | Ambulatory Disability |
| Immigrants | Zimbabwe | 99.8 /100 | #58 | Exceptional 5.6% |
| Immigrants | Afghanistan | 99.8 /100 | #59 | Exceptional 5.6% |
| Immigrants | Lithuania | 99.8 /100 | #60 | Exceptional 5.6% |
| Immigrants | Belgium | 99.7 /100 | #61 | Exceptional 5.6% |
| Immigrants | Spain | 99.7 /100 | #62 | Exceptional 5.6% |
| Immigrants | France | 99.7 /100 | #63 | Exceptional 5.6% |
| Laotians | 99.7 /100 | #64 | Exceptional 5.7% |
| Immigrants | Switzerland | 99.7 /100 | #65 | Exceptional 5.7% |
| Israelis | 99.6 /100 | #66 | Exceptional 5.7% |
| Immigrants | Uganda | 99.6 /100 | #67 | Exceptional 5.7% |
| Sri Lankans | 99.6 /100 | #68 | Exceptional 5.7% |
| Peruvians | 99.5 /100 | #69 | Exceptional 5.7% |
| Sierra Leoneans | 99.4 /100 | #70 | Exceptional 5.7% |
| Immigrants | Peru | 99.4 /100 | #71 | Exceptional 5.7% |
| Brazilians | 99.4 /100 | #72 | Exceptional 5.7% |