Shoshone vs Immigrants from Somalia Disability Age 5 to 17
COMPARE
Shoshone
Immigrants from Somalia
Disability Age 5 to 17
Disability Age 5 to 17 Comparison
Shoshone
Immigrants from Somalia
5.6%
DISABILITY AGE 5 TO 17
49.4/ 100
METRIC RATING
175th/ 347
METRIC RANK
6.0%
DISABILITY AGE 5 TO 17
0.4/ 100
METRIC RATING
270th/ 347
METRIC RANK
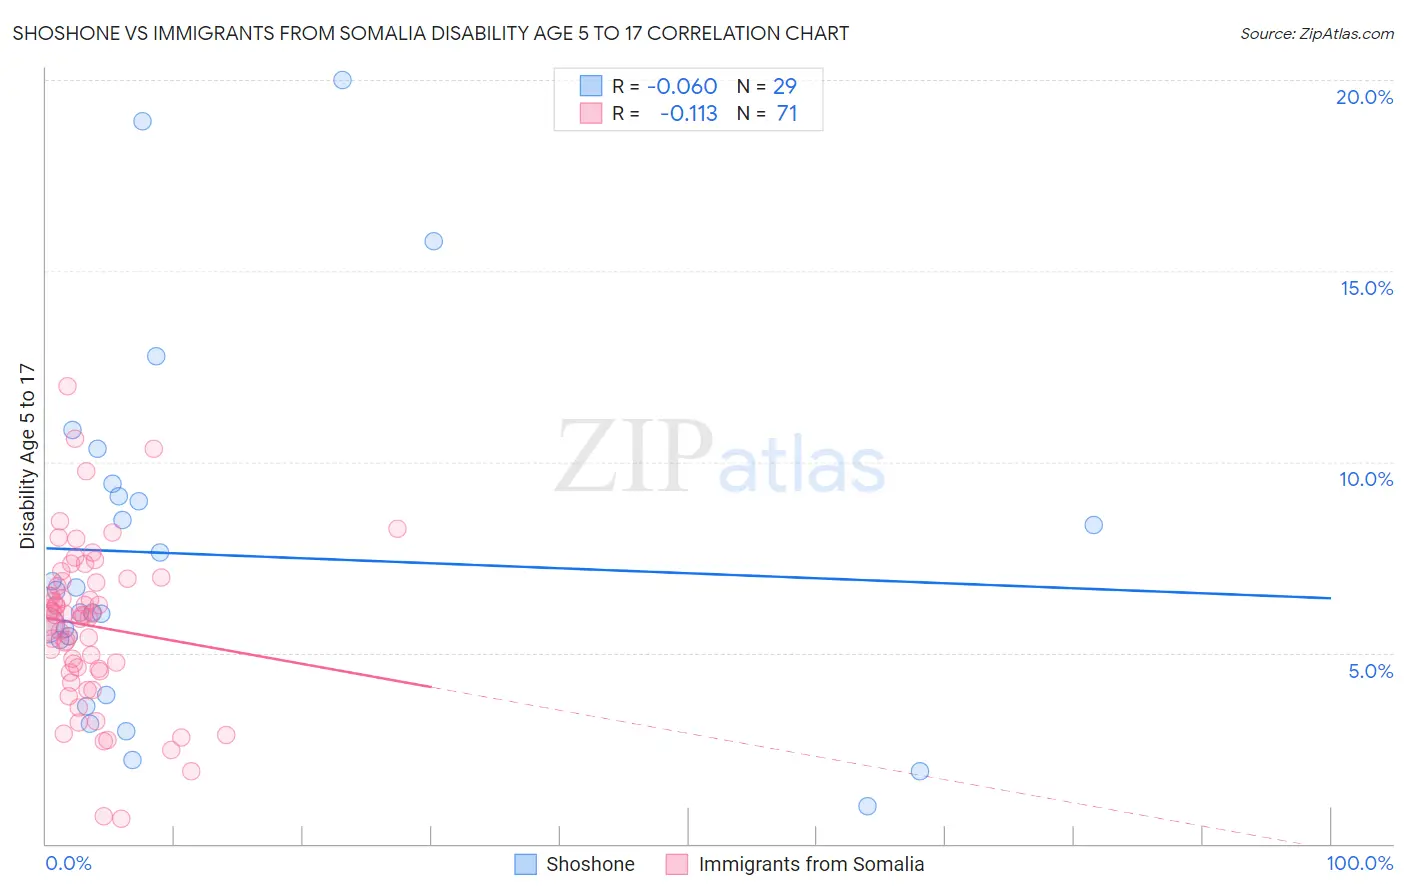
Shoshone vs Immigrants from Somalia Disability Age 5 to 17 Correlation Chart
The statistical analysis conducted on geographies consisting of 66,499,721 people shows a slight negative correlation between the proportion of Shoshone and percentage of population with a disability between the ages 5 and 17 in the United States with a correlation coefficient (R) of -0.060 and weighted average of 5.6%. Similarly, the statistical analysis conducted on geographies consisting of 92,029,922 people shows a poor negative correlation between the proportion of Immigrants from Somalia and percentage of population with a disability between the ages 5 and 17 in the United States with a correlation coefficient (R) of -0.113 and weighted average of 6.0%, a difference of 6.9%.
Disability Age 5 to 17 Correlation Summary
| Measurement | Shoshone | Immigrants from Somalia |
| Minimum | 0.97% | 0.64% |
| Maximum | 20.0% | 12.0% |
| Range | 19.0% | 11.3% |
| Mean | 7.6% | 5.7% |
| Median | 6.6% | 6.0% |
| Interquartile 25% (IQ1) | 4.6% | 4.5% |
| Interquartile 75% (IQ3) | 9.3% | 6.9% |
| Interquartile Range (IQR) | 4.7% | 2.4% |
| Standard Deviation (Sample) | 4.7% | 2.1% |
| Standard Deviation (Population) | 4.6% | 2.1% |
Similar Demographics by Disability Age 5 to 17
Demographics Similar to Shoshone by Disability Age 5 to 17
In terms of disability age 5 to 17, the demographic groups most similar to Shoshone are Immigrants from Central America (5.6%, a difference of 0.0%), Costa Rican (5.6%, a difference of 0.030%), Uruguayan (5.6%, a difference of 0.080%), Immigrants from Western Europe (5.6%, a difference of 0.080%), and Immigrants from Trinidad and Tobago (5.6%, a difference of 0.090%).
| Demographics | Rating | Rank | Disability Age 5 to 17 |
| Iraqis | 56.0 /100 | #168 | Average 5.6% |
| Immigrants | Norway | 55.7 /100 | #169 | Average 5.6% |
| Serbians | 54.0 /100 | #170 | Average 5.6% |
| Immigrants | Iraq | 53.9 /100 | #171 | Average 5.6% |
| Ukrainians | 51.5 /100 | #172 | Average 5.6% |
| Uruguayans | 51.0 /100 | #173 | Average 5.6% |
| Costa Ricans | 50.0 /100 | #174 | Average 5.6% |
| Shoshone | 49.4 /100 | #175 | Average 5.6% |
| Immigrants | Central America | 49.4 /100 | #176 | Average 5.6% |
| Immigrants | Western Europe | 47.8 /100 | #177 | Average 5.6% |
| Immigrants | Trinidad and Tobago | 47.6 /100 | #178 | Average 5.6% |
| Immigrants | Barbados | 40.5 /100 | #179 | Average 5.6% |
| Immigrants | Uruguay | 37.7 /100 | #180 | Fair 5.6% |
| Immigrants | England | 36.4 /100 | #181 | Fair 5.6% |
| Mexican American Indians | 35.2 /100 | #182 | Fair 5.6% |
Demographics Similar to Immigrants from Somalia by Disability Age 5 to 17
In terms of disability age 5 to 17, the demographic groups most similar to Immigrants from Somalia are Liberian (6.0%, a difference of 0.19%), Sioux (6.0%, a difference of 0.22%), Spanish (6.0%, a difference of 0.41%), Slovene (6.0%, a difference of 0.52%), and Panamanian (6.0%, a difference of 0.55%).
| Demographics | Rating | Rank | Disability Age 5 to 17 |
| Czechoslovakians | 0.7 /100 | #263 | Tragic 5.9% |
| Canadians | 0.6 /100 | #264 | Tragic 6.0% |
| Panamanians | 0.6 /100 | #265 | Tragic 6.0% |
| Slovenes | 0.6 /100 | #266 | Tragic 6.0% |
| Spanish | 0.5 /100 | #267 | Tragic 6.0% |
| Sioux | 0.4 /100 | #268 | Tragic 6.0% |
| Liberians | 0.4 /100 | #269 | Tragic 6.0% |
| Immigrants | Somalia | 0.4 /100 | #270 | Tragic 6.0% |
| Immigrants | Zaire | 0.2 /100 | #271 | Tragic 6.0% |
| Finns | 0.2 /100 | #272 | Tragic 6.0% |
| Alaska Natives | 0.2 /100 | #273 | Tragic 6.0% |
| Cheyenne | 0.2 /100 | #274 | Tragic 6.0% |
| Dutch | 0.2 /100 | #275 | Tragic 6.0% |
| Japanese | 0.1 /100 | #276 | Tragic 6.1% |
| Puget Sound Salish | 0.1 /100 | #277 | Tragic 6.1% |