Navajo vs Immigrants from Somalia Disability Age 5 to 17
COMPARE
Navajo
Immigrants from Somalia
Disability Age 5 to 17
Disability Age 5 to 17 Comparison
Navajo
Immigrants from Somalia
5.4%
DISABILITY AGE 5 TO 17
90.9/ 100
METRIC RATING
137th/ 347
METRIC RANK
6.0%
DISABILITY AGE 5 TO 17
0.4/ 100
METRIC RATING
270th/ 347
METRIC RANK
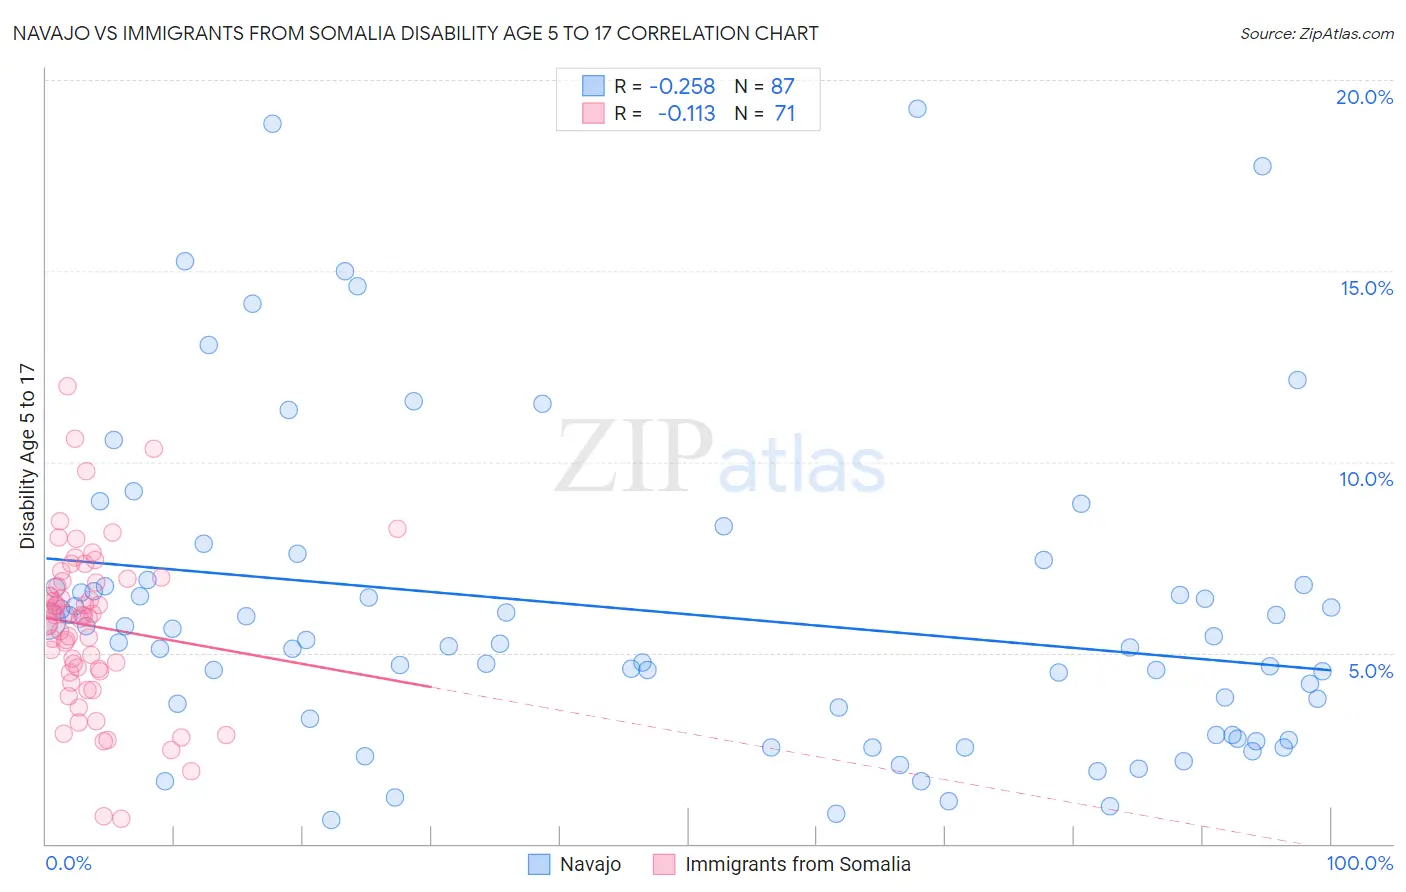
Navajo vs Immigrants from Somalia Disability Age 5 to 17 Correlation Chart
The statistical analysis conducted on geographies consisting of 223,670,452 people shows a weak negative correlation between the proportion of Navajo and percentage of population with a disability between the ages 5 and 17 in the United States with a correlation coefficient (R) of -0.258 and weighted average of 5.4%. Similarly, the statistical analysis conducted on geographies consisting of 92,029,922 people shows a poor negative correlation between the proportion of Immigrants from Somalia and percentage of population with a disability between the ages 5 and 17 in the United States with a correlation coefficient (R) of -0.113 and weighted average of 6.0%, a difference of 10.1%.
Disability Age 5 to 17 Correlation Summary
| Measurement | Navajo | Immigrants from Somalia |
| Minimum | 0.63% | 0.64% |
| Maximum | 19.3% | 12.0% |
| Range | 18.6% | 11.3% |
| Mean | 6.1% | 5.7% |
| Median | 5.3% | 6.0% |
| Interquartile 25% (IQ1) | 2.8% | 4.5% |
| Interquartile 75% (IQ3) | 6.8% | 6.9% |
| Interquartile Range (IQR) | 3.9% | 2.4% |
| Standard Deviation (Sample) | 4.1% | 2.1% |
| Standard Deviation (Population) | 4.1% | 2.1% |
Similar Demographics by Disability Age 5 to 17
Demographics Similar to Navajo by Disability Age 5 to 17
In terms of disability age 5 to 17, the demographic groups most similar to Navajo are Immigrants from Oceania (5.4%, a difference of 0.0%), Belizean (5.4%, a difference of 0.010%), Immigrants from Netherlands (5.4%, a difference of 0.060%), Immigrants from Denmark (5.4%, a difference of 0.080%), and Immigrants from Belize (5.4%, a difference of 0.13%).
| Demographics | Rating | Rank | Disability Age 5 to 17 |
| Immigrants | Bulgaria | 94.0 /100 | #130 | Exceptional 5.4% |
| Arabs | 92.9 /100 | #131 | Exceptional 5.4% |
| Immigrants | Colombia | 92.9 /100 | #132 | Exceptional 5.4% |
| Venezuelans | 92.7 /100 | #133 | Exceptional 5.4% |
| Yuman | 92.3 /100 | #134 | Exceptional 5.4% |
| Immigrants | Belize | 91.7 /100 | #135 | Exceptional 5.4% |
| Immigrants | Denmark | 91.4 /100 | #136 | Exceptional 5.4% |
| Navajo | 90.9 /100 | #137 | Exceptional 5.4% |
| Immigrants | Oceania | 90.8 /100 | #138 | Exceptional 5.4% |
| Belizeans | 90.8 /100 | #139 | Exceptional 5.4% |
| Immigrants | Netherlands | 90.5 /100 | #140 | Exceptional 5.4% |
| South American Indians | 89.3 /100 | #141 | Excellent 5.5% |
| Colombians | 88.0 /100 | #142 | Excellent 5.5% |
| Immigrants | Hungary | 87.9 /100 | #143 | Excellent 5.5% |
| Pakistanis | 87.3 /100 | #144 | Excellent 5.5% |
Demographics Similar to Immigrants from Somalia by Disability Age 5 to 17
In terms of disability age 5 to 17, the demographic groups most similar to Immigrants from Somalia are Liberian (6.0%, a difference of 0.19%), Sioux (6.0%, a difference of 0.22%), Spanish (6.0%, a difference of 0.41%), Slovene (6.0%, a difference of 0.52%), and Panamanian (6.0%, a difference of 0.55%).
| Demographics | Rating | Rank | Disability Age 5 to 17 |
| Czechoslovakians | 0.7 /100 | #263 | Tragic 5.9% |
| Canadians | 0.6 /100 | #264 | Tragic 6.0% |
| Panamanians | 0.6 /100 | #265 | Tragic 6.0% |
| Slovenes | 0.6 /100 | #266 | Tragic 6.0% |
| Spanish | 0.5 /100 | #267 | Tragic 6.0% |
| Sioux | 0.4 /100 | #268 | Tragic 6.0% |
| Liberians | 0.4 /100 | #269 | Tragic 6.0% |
| Immigrants | Somalia | 0.4 /100 | #270 | Tragic 6.0% |
| Immigrants | Zaire | 0.2 /100 | #271 | Tragic 6.0% |
| Finns | 0.2 /100 | #272 | Tragic 6.0% |
| Alaska Natives | 0.2 /100 | #273 | Tragic 6.0% |
| Cheyenne | 0.2 /100 | #274 | Tragic 6.0% |
| Dutch | 0.2 /100 | #275 | Tragic 6.0% |
| Japanese | 0.1 /100 | #276 | Tragic 6.1% |
| Puget Sound Salish | 0.1 /100 | #277 | Tragic 6.1% |