Canadian vs Cajun Self-Care Disability
COMPARE
Canadian
Cajun
Self-Care Disability
Self-Care Disability Comparison
Canadians
Cajuns
2.5%
SELF-CARE DISABILITY
58.8/ 100
METRIC RATING
166th/ 347
METRIC RANK
2.9%
SELF-CARE DISABILITY
0.0/ 100
METRIC RATING
329th/ 347
METRIC RANK
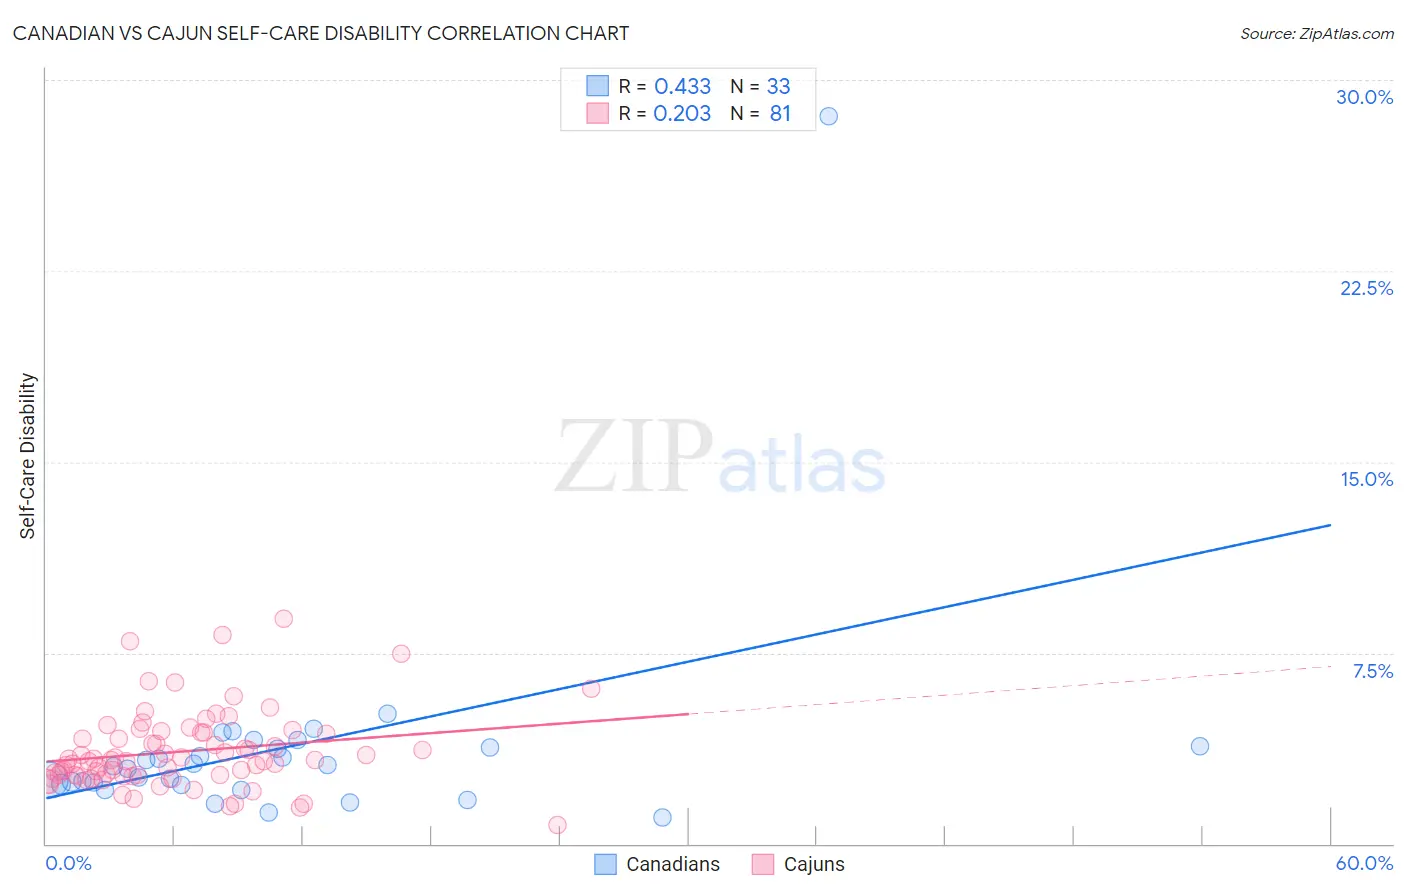
Canadian vs Cajun Self-Care Disability Correlation Chart
The statistical analysis conducted on geographies consisting of 436,894,568 people shows a moderate positive correlation between the proportion of Canadians and percentage of population with self-care disability in the United States with a correlation coefficient (R) of 0.433 and weighted average of 2.5%. Similarly, the statistical analysis conducted on geographies consisting of 149,634,207 people shows a weak positive correlation between the proportion of Cajuns and percentage of population with self-care disability in the United States with a correlation coefficient (R) of 0.203 and weighted average of 2.9%, a difference of 19.7%.
Self-Care Disability Correlation Summary
| Measurement | Canadian | Cajun |
| Minimum | 1.1% | 0.75% |
| Maximum | 28.6% | 8.8% |
| Range | 27.5% | 8.1% |
| Mean | 3.7% | 3.6% |
| Median | 3.0% | 3.3% |
| Interquartile 25% (IQ1) | 2.3% | 2.7% |
| Interquartile 75% (IQ3) | 3.8% | 4.4% |
| Interquartile Range (IQR) | 1.5% | 1.7% |
| Standard Deviation (Sample) | 4.6% | 1.5% |
| Standard Deviation (Population) | 4.5% | 1.5% |
Similar Demographics by Self-Care Disability
Demographics Similar to Canadians by Self-Care Disability
In terms of self-care disability, the demographic groups most similar to Canadians are Syrian (2.5%, a difference of 0.010%), Immigrants from Vietnam (2.5%, a difference of 0.030%), Immigrants from Greece (2.5%, a difference of 0.070%), Ute (2.5%, a difference of 0.080%), and Immigrants from Somalia (2.5%, a difference of 0.14%).
| Demographics | Rating | Rank | Self-Care Disability |
| Immigrants | Italy | 68.5 /100 | #159 | Good 2.4% |
| Finns | 67.0 /100 | #160 | Good 2.4% |
| Lebanese | 66.5 /100 | #161 | Good 2.4% |
| Somalis | 63.7 /100 | #162 | Good 2.5% |
| German Russians | 62.7 /100 | #163 | Good 2.5% |
| Immigrants | Vietnam | 59.3 /100 | #164 | Average 2.5% |
| Syrians | 59.0 /100 | #165 | Average 2.5% |
| Canadians | 58.8 /100 | #166 | Average 2.5% |
| Immigrants | Greece | 57.3 /100 | #167 | Average 2.5% |
| Ute | 57.1 /100 | #168 | Average 2.5% |
| Immigrants | Somalia | 55.9 /100 | #169 | Average 2.5% |
| Scottish | 54.3 /100 | #170 | Average 2.5% |
| Pennsylvania Germans | 53.5 /100 | #171 | Average 2.5% |
| Czechoslovakians | 53.5 /100 | #172 | Average 2.5% |
| Immigrants | Burma/Myanmar | 52.8 /100 | #173 | Average 2.5% |
Demographics Similar to Cajuns by Self-Care Disability
In terms of self-care disability, the demographic groups most similar to Cajuns are Hopi (2.9%, a difference of 0.21%), Black/African American (2.9%, a difference of 0.60%), Paiute (2.9%, a difference of 0.67%), Nepalese (3.0%, a difference of 0.75%), and Lumbee (3.0%, a difference of 0.87%).
| Demographics | Rating | Rank | Self-Care Disability |
| Comanche | 0.0 /100 | #322 | Tragic 2.9% |
| Seminole | 0.0 /100 | #323 | Tragic 2.9% |
| Cherokee | 0.0 /100 | #324 | Tragic 2.9% |
| Immigrants | Uzbekistan | 0.0 /100 | #325 | Tragic 2.9% |
| Paiute | 0.0 /100 | #326 | Tragic 2.9% |
| Blacks/African Americans | 0.0 /100 | #327 | Tragic 2.9% |
| Hopi | 0.0 /100 | #328 | Tragic 2.9% |
| Cajuns | 0.0 /100 | #329 | Tragic 2.9% |
| Nepalese | 0.0 /100 | #330 | Tragic 3.0% |
| Lumbee | 0.0 /100 | #331 | Tragic 3.0% |
| Kiowa | 0.0 /100 | #332 | Tragic 3.0% |
| Dutch West Indians | 0.0 /100 | #333 | Tragic 3.0% |
| Houma | 0.0 /100 | #334 | Tragic 3.0% |
| Immigrants | Azores | 0.0 /100 | #335 | Tragic 3.0% |
| Immigrants | Yemen | 0.0 /100 | #336 | Tragic 3.0% |