Canadian vs Mongolian Ambulatory Disability
COMPARE
Canadian
Mongolian
Ambulatory Disability
Ambulatory Disability Comparison
Canadians
Mongolians
6.3%
AMBULATORY DISABILITY
10.9/ 100
METRIC RATING
216th/ 347
METRIC RANK
5.5%
AMBULATORY DISABILITY
99.9/ 100
METRIC RATING
41st/ 347
METRIC RANK
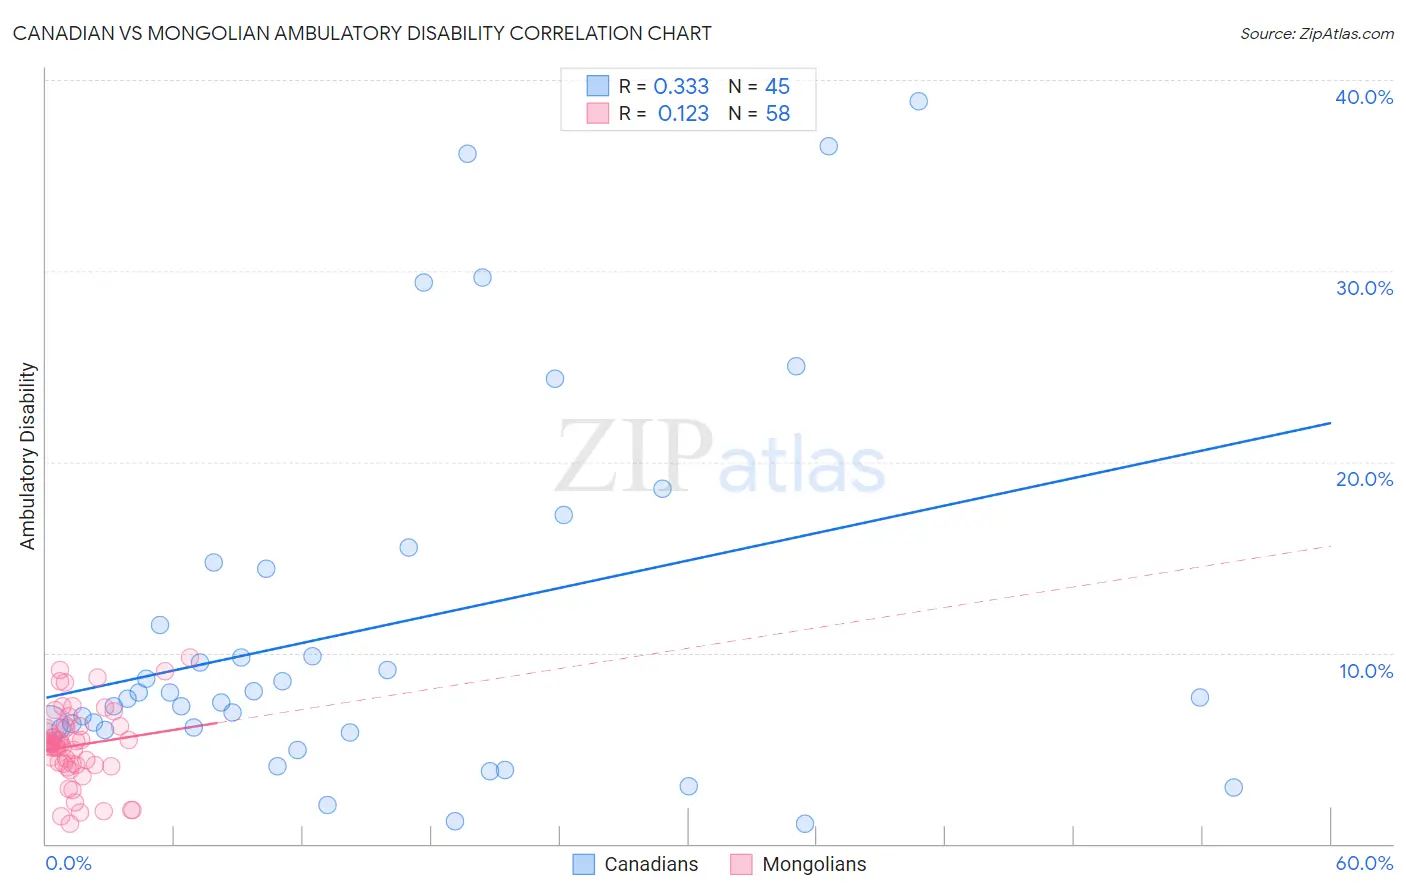
Canadian vs Mongolian Ambulatory Disability Correlation Chart
The statistical analysis conducted on geographies consisting of 437,391,973 people shows a mild positive correlation between the proportion of Canadians and percentage of population with ambulatory disability in the United States with a correlation coefficient (R) of 0.333 and weighted average of 6.3%. Similarly, the statistical analysis conducted on geographies consisting of 140,347,726 people shows a poor positive correlation between the proportion of Mongolians and percentage of population with ambulatory disability in the United States with a correlation coefficient (R) of 0.123 and weighted average of 5.5%, a difference of 14.2%.
Ambulatory Disability Correlation Summary
| Measurement | Canadian | Mongolian |
| Minimum | 1.0% | 1.0% |
| Maximum | 38.9% | 9.8% |
| Range | 37.8% | 8.7% |
| Mean | 11.4% | 5.2% |
| Median | 7.7% | 5.2% |
| Interquartile 25% (IQ1) | 6.0% | 4.1% |
| Interquartile 75% (IQ3) | 14.6% | 6.1% |
| Interquartile Range (IQR) | 8.6% | 2.0% |
| Standard Deviation (Sample) | 9.7% | 2.0% |
| Standard Deviation (Population) | 9.6% | 2.0% |
Similar Demographics by Ambulatory Disability
Demographics Similar to Canadians by Ambulatory Disability
In terms of ambulatory disability, the demographic groups most similar to Canadians are Yugoslavian (6.3%, a difference of 0.0%), Immigrants from Latin America (6.3%, a difference of 0.010%), Immigrants from Mexico (6.3%, a difference of 0.020%), Guamanian/Chamorro (6.3%, a difference of 0.040%), and Mexican American Indian (6.3%, a difference of 0.14%).
| Demographics | Rating | Rank | Ambulatory Disability |
| Immigrants | Iraq | 14.0 /100 | #209 | Poor 6.3% |
| Immigrants | Laos | 13.2 /100 | #210 | Poor 6.3% |
| Samoans | 12.1 /100 | #211 | Poor 6.3% |
| Mexican American Indians | 12.0 /100 | #212 | Poor 6.3% |
| Japanese | 12.0 /100 | #213 | Poor 6.3% |
| Immigrants | Mexico | 11.0 /100 | #214 | Poor 6.3% |
| Immigrants | Latin America | 11.0 /100 | #215 | Poor 6.3% |
| Canadians | 10.9 /100 | #216 | Poor 6.3% |
| Yugoslavians | 10.9 /100 | #217 | Poor 6.3% |
| Guamanians/Chamorros | 10.6 /100 | #218 | Poor 6.3% |
| Indonesians | 9.9 /100 | #219 | Tragic 6.3% |
| Immigrants | Albania | 9.6 /100 | #220 | Tragic 6.3% |
| Hungarians | 9.6 /100 | #221 | Tragic 6.3% |
| German Russians | 9.4 /100 | #222 | Tragic 6.3% |
| Immigrants | Honduras | 7.6 /100 | #223 | Tragic 6.3% |
Demographics Similar to Mongolians by Ambulatory Disability
In terms of ambulatory disability, the demographic groups most similar to Mongolians are Venezuelan (5.5%, a difference of 0.080%), Argentinean (5.5%, a difference of 0.080%), Immigrants from Eritrea (5.5%, a difference of 0.42%), Turkish (5.5%, a difference of 0.51%), and Cypriot (5.5%, a difference of 0.51%).
| Demographics | Rating | Rank | Ambulatory Disability |
| Immigrants | Asia | 100.0 /100 | #34 | Exceptional 5.5% |
| Afghans | 100.0 /100 | #35 | Exceptional 5.5% |
| Immigrants | Malaysia | 100.0 /100 | #36 | Exceptional 5.5% |
| Turks | 100.0 /100 | #37 | Exceptional 5.5% |
| Cypriots | 100.0 /100 | #38 | Exceptional 5.5% |
| Immigrants | Eritrea | 100.0 /100 | #39 | Exceptional 5.5% |
| Venezuelans | 99.9 /100 | #40 | Exceptional 5.5% |
| Mongolians | 99.9 /100 | #41 | Exceptional 5.5% |
| Argentineans | 99.9 /100 | #42 | Exceptional 5.5% |
| Paraguayans | 99.9 /100 | #43 | Exceptional 5.5% |
| Immigrants | Indonesia | 99.9 /100 | #44 | Exceptional 5.5% |
| Immigrants | Sweden | 99.9 /100 | #45 | Exceptional 5.6% |
| Egyptians | 99.9 /100 | #46 | Exceptional 5.6% |
| Immigrants | Japan | 99.9 /100 | #47 | Exceptional 5.6% |
| Immigrants | Argentina | 99.9 /100 | #48 | Exceptional 5.6% |