Austrian vs Immigrants from Belarus Disability Age Under 5
COMPARE
Austrian
Immigrants from Belarus
Disability Age Under 5
Disability Age Under 5 Comparison
Austrians
Immigrants from Belarus
1.4%
DISABILITY AGE UNDER 5
0.1/ 100
METRIC RATING
269th/ 347
METRIC RANK
1.0%
DISABILITY AGE UNDER 5
100.0/ 100
METRIC RATING
29th/ 347
METRIC RANK
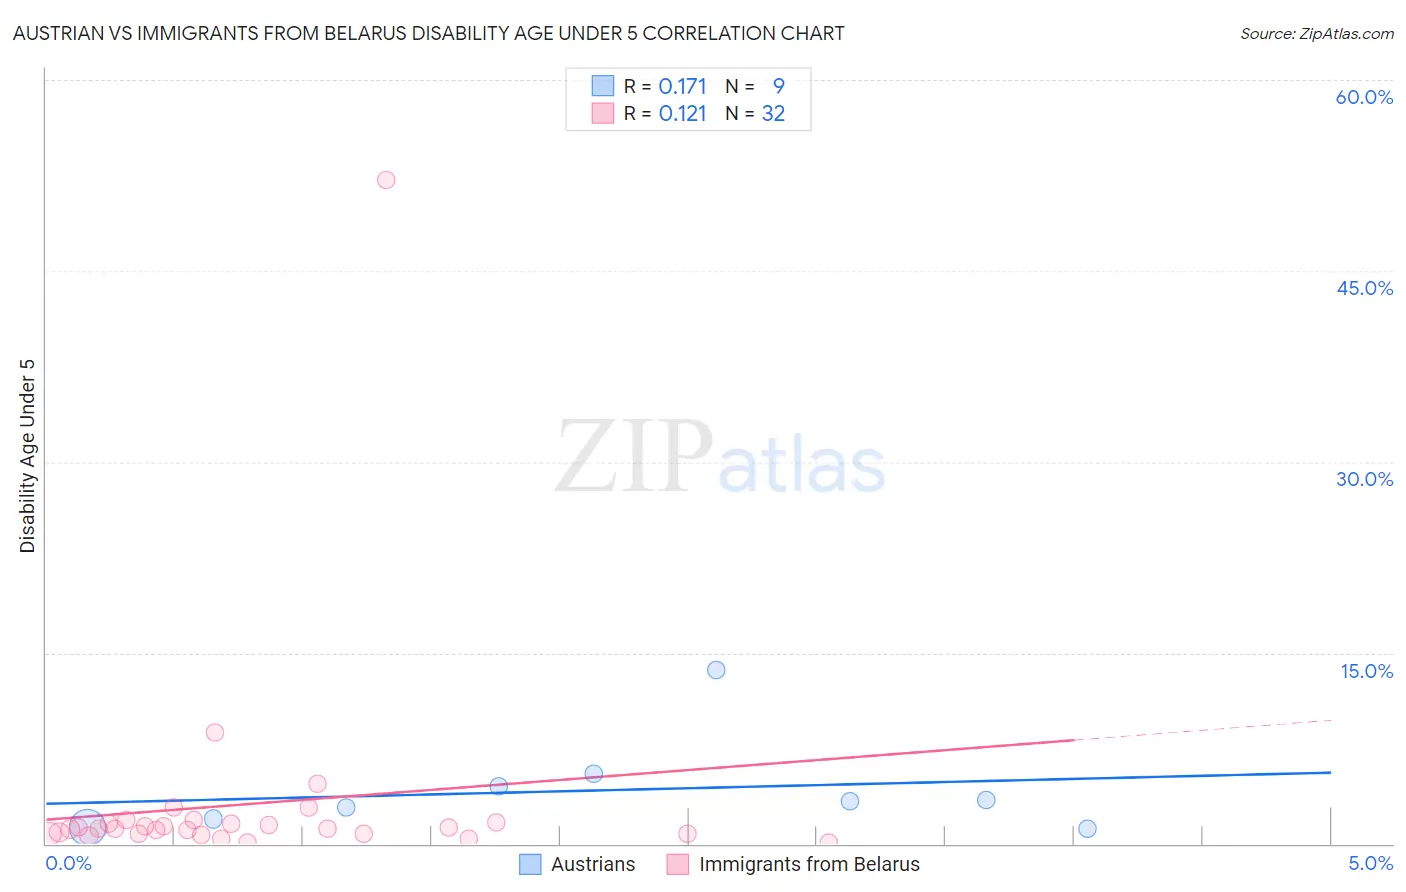
Austrian vs Immigrants from Belarus Disability Age Under 5 Correlation Chart
The statistical analysis conducted on geographies consisting of 227,811,367 people shows a poor positive correlation between the proportion of Austrians and percentage of population with a disability under the age of 5 in the United States with a correlation coefficient (R) of 0.171 and weighted average of 1.4%. Similarly, the statistical analysis conducted on geographies consisting of 102,408,276 people shows a poor positive correlation between the proportion of Immigrants from Belarus and percentage of population with a disability under the age of 5 in the United States with a correlation coefficient (R) of 0.121 and weighted average of 1.0%, a difference of 41.0%.
Disability Age Under 5 Correlation Summary
| Measurement | Austrian | Immigrants from Belarus |
| Minimum | 1.2% | 0.12% |
| Maximum | 13.7% | 52.1% |
| Range | 12.5% | 52.0% |
| Mean | 4.2% | 3.1% |
| Median | 3.4% | 1.2% |
| Interquartile 25% (IQ1) | 1.6% | 0.78% |
| Interquartile 75% (IQ3) | 5.0% | 1.6% |
| Interquartile Range (IQR) | 3.4% | 0.83% |
| Standard Deviation (Sample) | 3.8% | 9.1% |
| Standard Deviation (Population) | 3.6% | 8.9% |
Similar Demographics by Disability Age Under 5
Demographics Similar to Austrians by Disability Age Under 5
In terms of disability age under 5, the demographic groups most similar to Austrians are Immigrants from North America (1.4%, a difference of 0.13%), Immigrants from Canada (1.4%, a difference of 0.17%), Belgian (1.4%, a difference of 0.18%), Black/African American (1.4%, a difference of 0.33%), and Alaskan Athabascan (1.5%, a difference of 0.63%).
| Demographics | Rating | Rank | Disability Age Under 5 |
| Immigrants | Dominica | 0.2 /100 | #262 | Tragic 1.4% |
| Spanish | 0.2 /100 | #263 | Tragic 1.4% |
| Yugoslavians | 0.1 /100 | #264 | Tragic 1.4% |
| Carpatho Rusyns | 0.1 /100 | #265 | Tragic 1.4% |
| Immigrants | Germany | 0.1 /100 | #266 | Tragic 1.4% |
| Cree | 0.1 /100 | #267 | Tragic 1.4% |
| Belgians | 0.1 /100 | #268 | Tragic 1.4% |
| Austrians | 0.1 /100 | #269 | Tragic 1.4% |
| Immigrants | North America | 0.1 /100 | #270 | Tragic 1.4% |
| Immigrants | Canada | 0.1 /100 | #271 | Tragic 1.4% |
| Blacks/African Americans | 0.1 /100 | #272 | Tragic 1.4% |
| Alaskan Athabascans | 0.1 /100 | #273 | Tragic 1.5% |
| Iroquois | 0.0 /100 | #274 | Tragic 1.5% |
| Brazilians | 0.0 /100 | #275 | Tragic 1.5% |
| Greeks | 0.0 /100 | #276 | Tragic 1.5% |
Demographics Similar to Immigrants from Belarus by Disability Age Under 5
In terms of disability age under 5, the demographic groups most similar to Immigrants from Belarus are Immigrants from Eastern Asia (1.0%, a difference of 0.12%), Immigrants from South Central Asia (1.0%, a difference of 0.52%), Guyanese (1.0%, a difference of 0.76%), Armenian (1.0%, a difference of 0.81%), and Iranian (1.0%, a difference of 0.86%).
| Demographics | Rating | Rank | Disability Age Under 5 |
| Immigrants | Iran | 100.0 /100 | #22 | Exceptional 1.00% |
| Yakama | 100.0 /100 | #23 | Exceptional 1.00% |
| Indians (Asian) | 100.0 /100 | #24 | Exceptional 1.0% |
| Immigrants | Micronesia | 100.0 /100 | #25 | Exceptional 1.0% |
| Immigrants | Taiwan | 100.0 /100 | #26 | Exceptional 1.0% |
| Guyanese | 100.0 /100 | #27 | Exceptional 1.0% |
| Immigrants | Eastern Asia | 100.0 /100 | #28 | Exceptional 1.0% |
| Immigrants | Belarus | 100.0 /100 | #29 | Exceptional 1.0% |
| Immigrants | South Central Asia | 99.9 /100 | #30 | Exceptional 1.0% |
| Armenians | 99.9 /100 | #31 | Exceptional 1.0% |
| Iranians | 99.9 /100 | #32 | Exceptional 1.0% |
| Bolivians | 99.9 /100 | #33 | Exceptional 1.0% |
| Immigrants | Ukraine | 99.9 /100 | #34 | Exceptional 1.0% |
| Barbadians | 99.9 /100 | #35 | Exceptional 1.0% |
| Immigrants | Nepal | 99.9 /100 | #36 | Exceptional 1.0% |