Immigrants from South America vs Immigrants from Belarus Disability Age Under 5
COMPARE
Immigrants from South America
Immigrants from Belarus
Disability Age Under 5
Disability Age Under 5 Comparison
Immigrants from South America
Immigrants from Belarus
1.2%
DISABILITY AGE UNDER 5
67.0/ 100
METRIC RATING
157th/ 347
METRIC RANK
1.0%
DISABILITY AGE UNDER 5
100.0/ 100
METRIC RATING
29th/ 347
METRIC RANK
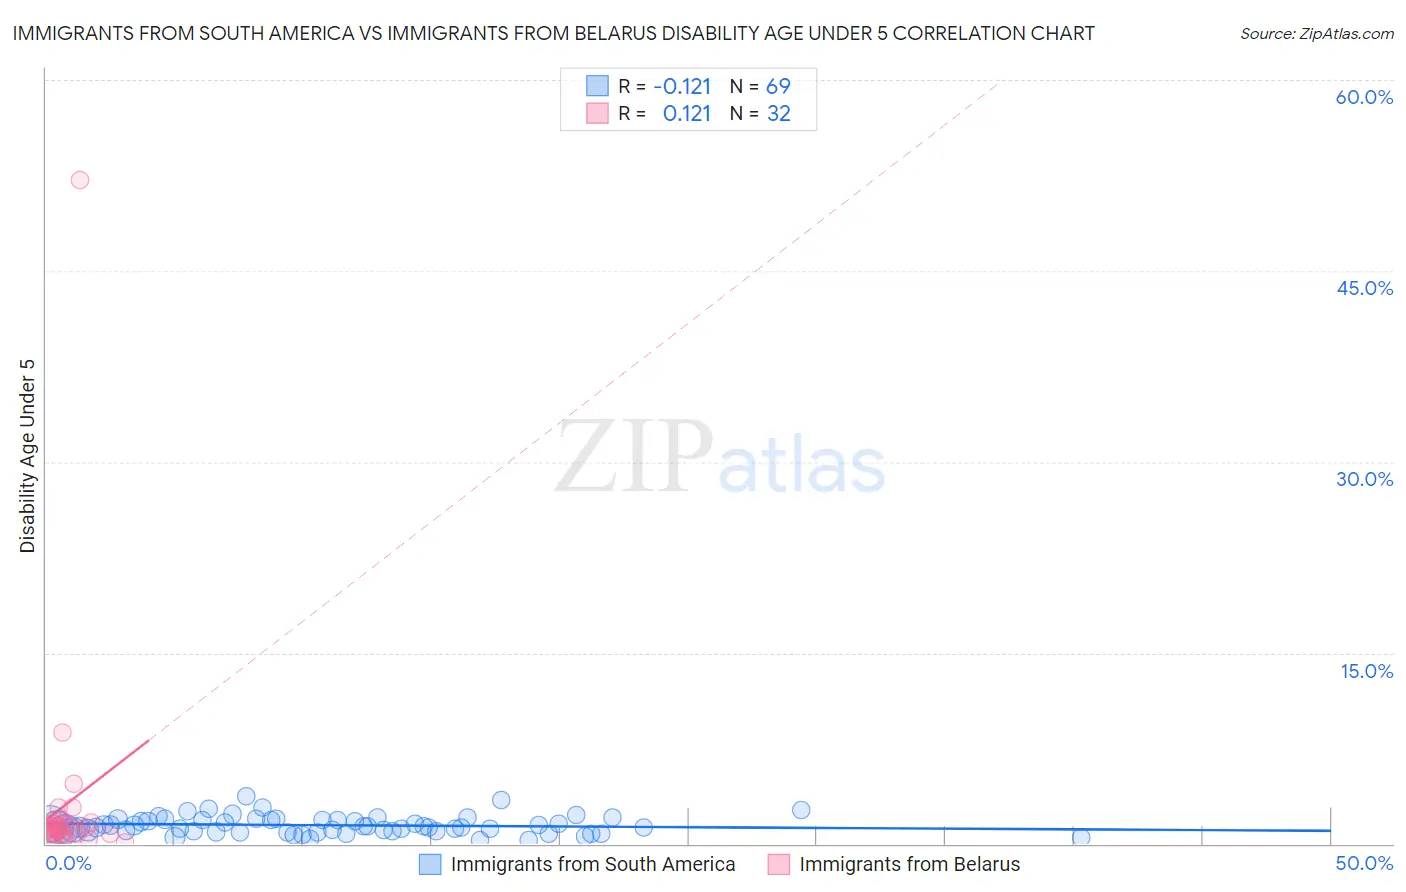
Immigrants from South America vs Immigrants from Belarus Disability Age Under 5 Correlation Chart
The statistical analysis conducted on geographies consisting of 244,519,101 people shows a poor negative correlation between the proportion of Immigrants from South America and percentage of population with a disability under the age of 5 in the United States with a correlation coefficient (R) of -0.121 and weighted average of 1.2%. Similarly, the statistical analysis conducted on geographies consisting of 102,408,276 people shows a poor positive correlation between the proportion of Immigrants from Belarus and percentage of population with a disability under the age of 5 in the United States with a correlation coefficient (R) of 0.121 and weighted average of 1.0%, a difference of 19.3%.
Disability Age Under 5 Correlation Summary
| Measurement | Immigrants from South America | Immigrants from Belarus |
| Minimum | 0.32% | 0.12% |
| Maximum | 3.8% | 52.1% |
| Range | 3.5% | 52.0% |
| Mean | 1.5% | 3.1% |
| Median | 1.3% | 1.2% |
| Interquartile 25% (IQ1) | 0.99% | 0.78% |
| Interquartile 75% (IQ3) | 1.9% | 1.6% |
| Interquartile Range (IQR) | 0.89% | 0.83% |
| Standard Deviation (Sample) | 0.70% | 9.1% |
| Standard Deviation (Population) | 0.70% | 8.9% |
Similar Demographics by Disability Age Under 5
Demographics Similar to Immigrants from South America by Disability Age Under 5
In terms of disability age under 5, the demographic groups most similar to Immigrants from South America are Arab (1.2%, a difference of 0.060%), Colombian (1.2%, a difference of 0.12%), Immigrants from Latin America (1.2%, a difference of 0.12%), Hawaiian (1.2%, a difference of 0.16%), and Immigrants from Ghana (1.2%, a difference of 0.18%).
| Demographics | Rating | Rank | Disability Age Under 5 |
| South Americans | 75.6 /100 | #150 | Good 1.2% |
| Yaqui | 74.8 /100 | #151 | Good 1.2% |
| Hondurans | 72.5 /100 | #152 | Good 1.2% |
| Immigrants | Thailand | 69.4 /100 | #153 | Good 1.2% |
| Uruguayans | 68.8 /100 | #154 | Good 1.2% |
| Immigrants | Ghana | 68.7 /100 | #155 | Good 1.2% |
| Hawaiians | 68.5 /100 | #156 | Good 1.2% |
| Immigrants | South America | 67.0 /100 | #157 | Good 1.2% |
| Arabs | 66.4 /100 | #158 | Good 1.2% |
| Colombians | 65.8 /100 | #159 | Good 1.2% |
| Immigrants | Latin America | 65.8 /100 | #160 | Good 1.2% |
| Immigrants | Africa | 65.1 /100 | #161 | Good 1.2% |
| Guatemalans | 63.6 /100 | #162 | Good 1.2% |
| Immigrants | Guatemala | 63.2 /100 | #163 | Good 1.2% |
| Laotians | 62.8 /100 | #164 | Good 1.2% |
Demographics Similar to Immigrants from Belarus by Disability Age Under 5
In terms of disability age under 5, the demographic groups most similar to Immigrants from Belarus are Immigrants from Eastern Asia (1.0%, a difference of 0.12%), Immigrants from South Central Asia (1.0%, a difference of 0.52%), Guyanese (1.0%, a difference of 0.76%), Armenian (1.0%, a difference of 0.81%), and Iranian (1.0%, a difference of 0.86%).
| Demographics | Rating | Rank | Disability Age Under 5 |
| Immigrants | Iran | 100.0 /100 | #22 | Exceptional 1.00% |
| Yakama | 100.0 /100 | #23 | Exceptional 1.00% |
| Indians (Asian) | 100.0 /100 | #24 | Exceptional 1.0% |
| Immigrants | Micronesia | 100.0 /100 | #25 | Exceptional 1.0% |
| Immigrants | Taiwan | 100.0 /100 | #26 | Exceptional 1.0% |
| Guyanese | 100.0 /100 | #27 | Exceptional 1.0% |
| Immigrants | Eastern Asia | 100.0 /100 | #28 | Exceptional 1.0% |
| Immigrants | Belarus | 100.0 /100 | #29 | Exceptional 1.0% |
| Immigrants | South Central Asia | 99.9 /100 | #30 | Exceptional 1.0% |
| Armenians | 99.9 /100 | #31 | Exceptional 1.0% |
| Iranians | 99.9 /100 | #32 | Exceptional 1.0% |
| Bolivians | 99.9 /100 | #33 | Exceptional 1.0% |
| Immigrants | Ukraine | 99.9 /100 | #34 | Exceptional 1.0% |
| Barbadians | 99.9 /100 | #35 | Exceptional 1.0% |
| Immigrants | Nepal | 99.9 /100 | #36 | Exceptional 1.0% |