Canadian vs Immigrants from Belarus 7th Grade
COMPARE
Canadian
Immigrants from Belarus
7th Grade
7th Grade Comparison
Canadians
Immigrants from Belarus
96.9%
7TH GRADE
99.7/ 100
METRIC RATING
65th/ 347
METRIC RANK
96.3%
7TH GRADE
82.4/ 100
METRIC RATING
150th/ 347
METRIC RANK
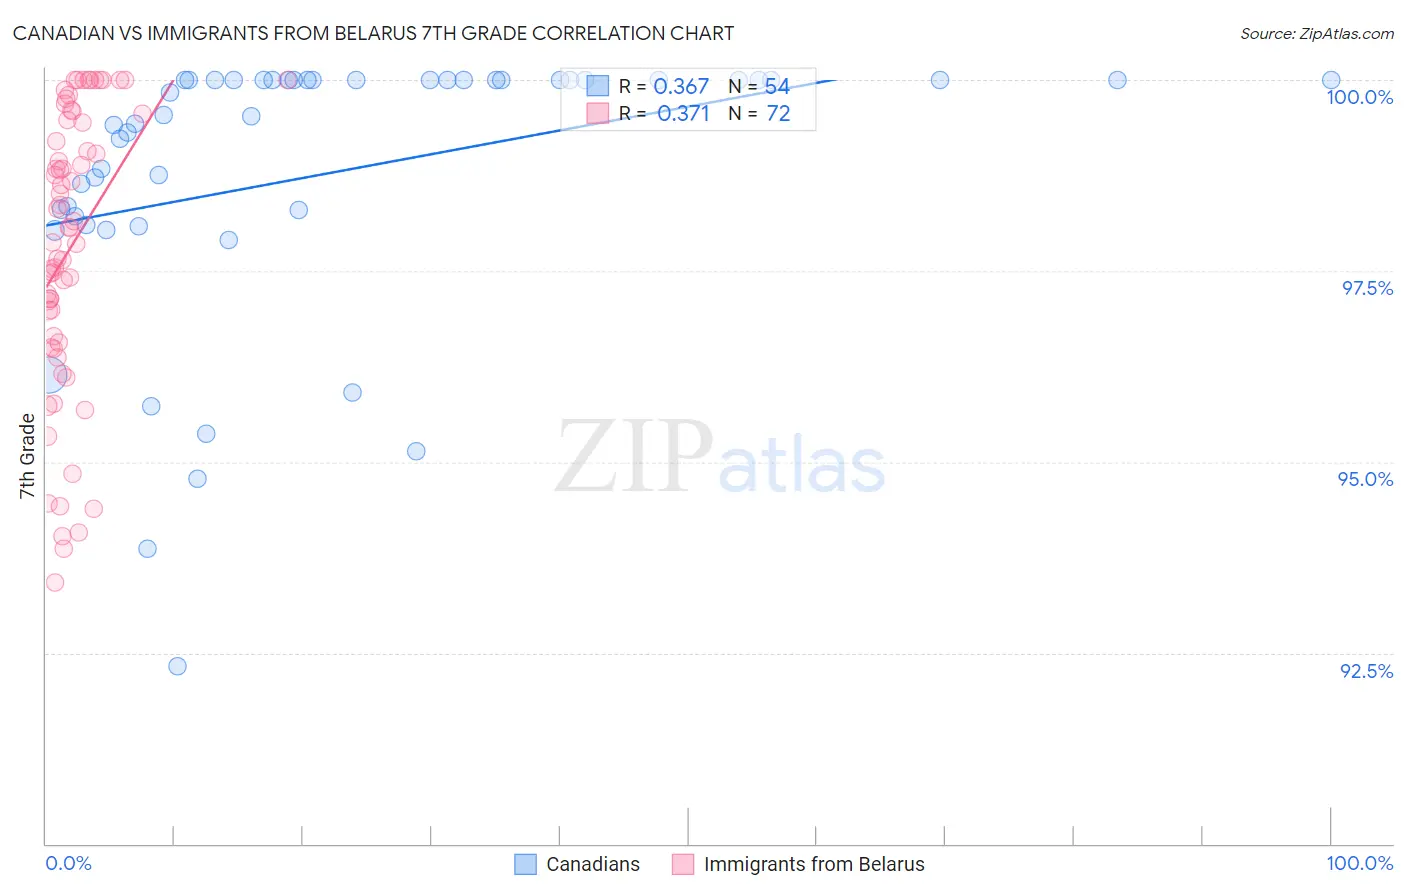
Canadian vs Immigrants from Belarus 7th Grade Correlation Chart
The statistical analysis conducted on geographies consisting of 437,556,929 people shows a mild positive correlation between the proportion of Canadians and percentage of population with at least 7th grade education in the United States with a correlation coefficient (R) of 0.367 and weighted average of 96.9%. Similarly, the statistical analysis conducted on geographies consisting of 149,993,317 people shows a mild positive correlation between the proportion of Immigrants from Belarus and percentage of population with at least 7th grade education in the United States with a correlation coefficient (R) of 0.371 and weighted average of 96.3%, a difference of 0.66%.
7th Grade Correlation Summary
| Measurement | Canadian | Immigrants from Belarus |
| Minimum | 92.3% | 93.4% |
| Maximum | 100.0% | 100.0% |
| Range | 7.7% | 6.6% |
| Mean | 98.8% | 97.8% |
| Median | 99.7% | 98.1% |
| Interquartile 25% (IQ1) | 98.2% | 96.6% |
| Interquartile 75% (IQ3) | 100.0% | 99.5% |
| Interquartile Range (IQR) | 1.8% | 2.9% |
| Standard Deviation (Sample) | 1.8% | 1.8% |
| Standard Deviation (Population) | 1.8% | 1.8% |
Similar Demographics by 7th Grade
Demographics Similar to Canadians by 7th Grade
In terms of 7th grade, the demographic groups most similar to Canadians are Immigrants from Northern Europe (96.9%, a difference of 0.010%), Immigrants from Austria (96.9%, a difference of 0.010%), Ukrainian (96.9%, a difference of 0.020%), Native Hawaiian (96.9%, a difference of 0.020%), and Creek (96.9%, a difference of 0.030%).
| Demographics | Rating | Rank | 7th Grade |
| Whites/Caucasians | 99.8 /100 | #58 | Exceptional 97.0% |
| Macedonians | 99.8 /100 | #59 | Exceptional 97.0% |
| Immigrants | Canada | 99.8 /100 | #60 | Exceptional 96.9% |
| Creek | 99.8 /100 | #61 | Exceptional 96.9% |
| Immigrants | North America | 99.8 /100 | #62 | Exceptional 96.9% |
| Immigrants | Northern Europe | 99.7 /100 | #63 | Exceptional 96.9% |
| Immigrants | Austria | 99.7 /100 | #64 | Exceptional 96.9% |
| Canadians | 99.7 /100 | #65 | Exceptional 96.9% |
| Ukrainians | 99.7 /100 | #66 | Exceptional 96.9% |
| Native Hawaiians | 99.7 /100 | #67 | Exceptional 96.9% |
| Immigrants | India | 99.6 /100 | #68 | Exceptional 96.9% |
| Iranians | 99.6 /100 | #69 | Exceptional 96.8% |
| New Zealanders | 99.6 /100 | #70 | Exceptional 96.8% |
| Immigrants | Lithuania | 99.6 /100 | #71 | Exceptional 96.8% |
| Cajuns | 99.5 /100 | #72 | Exceptional 96.8% |
Demographics Similar to Immigrants from Belarus by 7th Grade
In terms of 7th grade, the demographic groups most similar to Immigrants from Belarus are Israeli (96.3%, a difference of 0.0%), Albanian (96.3%, a difference of 0.0%), Immigrants from Eastern Europe (96.3%, a difference of 0.010%), French American Indian (96.3%, a difference of 0.010%), and Hopi (96.3%, a difference of 0.010%).
| Demographics | Rating | Rank | 7th Grade |
| Spanish | 86.6 /100 | #143 | Excellent 96.3% |
| Immigrants | Greece | 85.9 /100 | #144 | Excellent 96.3% |
| Blackfeet | 83.9 /100 | #145 | Excellent 96.3% |
| Immigrants | Eastern Europe | 83.7 /100 | #146 | Excellent 96.3% |
| French American Indians | 83.1 /100 | #147 | Excellent 96.3% |
| Israelis | 82.8 /100 | #148 | Excellent 96.3% |
| Albanians | 82.6 /100 | #149 | Excellent 96.3% |
| Immigrants | Belarus | 82.4 /100 | #150 | Excellent 96.3% |
| Hopi | 81.6 /100 | #151 | Excellent 96.3% |
| Immigrants | Russia | 78.4 /100 | #152 | Good 96.2% |
| Seminole | 78.1 /100 | #153 | Good 96.2% |
| Immigrants | Israel | 77.6 /100 | #154 | Good 96.2% |
| Immigrants | Jordan | 77.0 /100 | #155 | Good 96.2% |
| Kenyans | 76.2 /100 | #156 | Good 96.2% |
| Ugandans | 75.5 /100 | #157 | Good 96.2% |