Canadian vs Immigrants from Belarus Associate's Degree
COMPARE
Canadian
Immigrants from Belarus
Associate's Degree
Associate's Degree Comparison
Canadians
Immigrants from Belarus
47.5%
ASSOCIATE'S DEGREE
79.0/ 100
METRIC RATING
145th/ 347
METRIC RANK
52.8%
ASSOCIATE'S DEGREE
99.9/ 100
METRIC RATING
39th/ 347
METRIC RANK
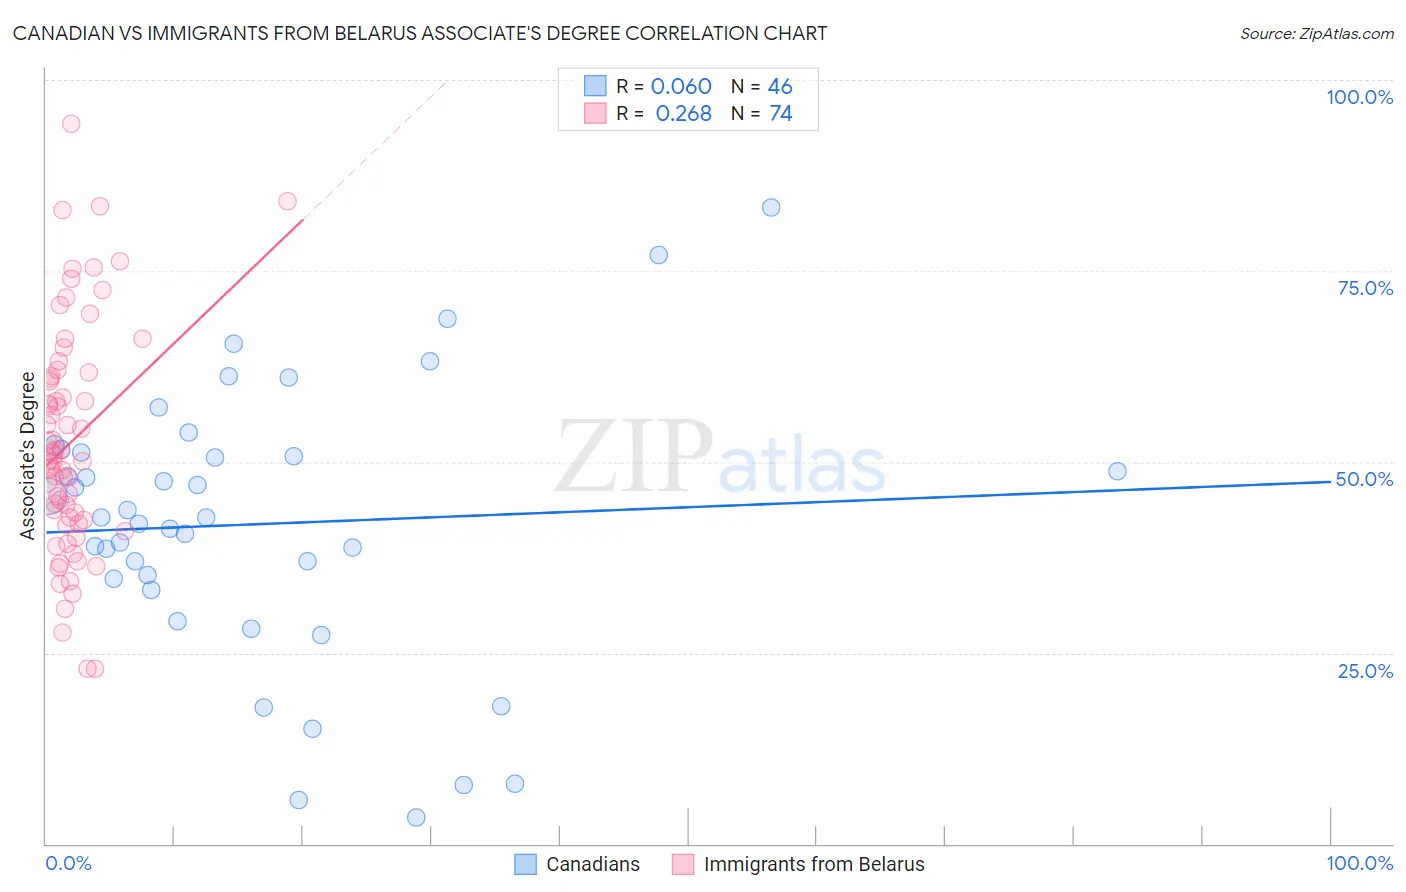
Canadian vs Immigrants from Belarus Associate's Degree Correlation Chart
The statistical analysis conducted on geographies consisting of 437,535,848 people shows a slight positive correlation between the proportion of Canadians and percentage of population with at least associate's degree education in the United States with a correlation coefficient (R) of 0.060 and weighted average of 47.5%. Similarly, the statistical analysis conducted on geographies consisting of 150,205,158 people shows a weak positive correlation between the proportion of Immigrants from Belarus and percentage of population with at least associate's degree education in the United States with a correlation coefficient (R) of 0.268 and weighted average of 52.8%, a difference of 11.2%.
Associate's Degree Correlation Summary
| Measurement | Canadian | Immigrants from Belarus |
| Minimum | 3.4% | 22.9% |
| Maximum | 83.3% | 94.2% |
| Range | 80.0% | 71.3% |
| Mean | 41.8% | 52.6% |
| Median | 42.7% | 50.5% |
| Interquartile 25% (IQ1) | 34.7% | 42.3% |
| Interquartile 75% (IQ3) | 51.3% | 61.3% |
| Interquartile Range (IQR) | 16.6% | 18.9% |
| Standard Deviation (Sample) | 17.8% | 14.8% |
| Standard Deviation (Population) | 17.6% | 14.7% |
Similar Demographics by Associate's Degree
Demographics Similar to Canadians by Associate's Degree
In terms of associate's degree, the demographic groups most similar to Canadians are Immigrants from Sudan (47.4%, a difference of 0.13%), Slavic (47.6%, a difference of 0.17%), Danish (47.4%, a difference of 0.18%), Norwegian (47.6%, a difference of 0.23%), and South American Indian (47.4%, a difference of 0.24%).
| Demographics | Rating | Rank | Associate's Degree |
| Poles | 87.3 /100 | #138 | Excellent 48.0% |
| Slovenes | 85.1 /100 | #139 | Excellent 47.9% |
| Immigrants | Southern Europe | 84.4 /100 | #140 | Excellent 47.8% |
| Taiwanese | 83.3 /100 | #141 | Excellent 47.7% |
| Sierra Leoneans | 82.9 /100 | #142 | Excellent 47.7% |
| Norwegians | 81.0 /100 | #143 | Excellent 47.6% |
| Slavs | 80.5 /100 | #144 | Excellent 47.6% |
| Canadians | 79.0 /100 | #145 | Good 47.5% |
| Immigrants | Sudan | 77.9 /100 | #146 | Good 47.4% |
| Danes | 77.3 /100 | #147 | Good 47.4% |
| South American Indians | 76.7 /100 | #148 | Good 47.4% |
| Immigrants | Armenia | 76.6 /100 | #149 | Good 47.4% |
| Iraqis | 76.2 /100 | #150 | Good 47.4% |
| Immigrants | North Macedonia | 76.0 /100 | #151 | Good 47.4% |
| Immigrants | Afghanistan | 74.3 /100 | #152 | Good 47.3% |
Demographics Similar to Immigrants from Belarus by Associate's Degree
In terms of associate's degree, the demographic groups most similar to Immigrants from Belarus are Immigrants from Latvia (52.8%, a difference of 0.070%), Mongolian (53.0%, a difference of 0.29%), Immigrants from Denmark (53.1%, a difference of 0.45%), Immigrants from Saudi Arabia (52.6%, a difference of 0.50%), and Immigrants from Russia (53.1%, a difference of 0.53%).
| Demographics | Rating | Rank | Associate's Degree |
| Immigrants | Turkey | 100.0 /100 | #32 | Exceptional 53.4% |
| Israelis | 100.0 /100 | #33 | Exceptional 53.4% |
| Bulgarians | 100.0 /100 | #34 | Exceptional 53.3% |
| Russians | 100.0 /100 | #35 | Exceptional 53.2% |
| Immigrants | Russia | 100.0 /100 | #36 | Exceptional 53.1% |
| Immigrants | Denmark | 100.0 /100 | #37 | Exceptional 53.1% |
| Mongolians | 100.0 /100 | #38 | Exceptional 53.0% |
| Immigrants | Belarus | 99.9 /100 | #39 | Exceptional 52.8% |
| Immigrants | Latvia | 99.9 /100 | #40 | Exceptional 52.8% |
| Immigrants | Saudi Arabia | 99.9 /100 | #41 | Exceptional 52.6% |
| Immigrants | Malaysia | 99.9 /100 | #42 | Exceptional 52.5% |
| Immigrants | South Africa | 99.9 /100 | #43 | Exceptional 52.5% |
| Estonians | 99.9 /100 | #44 | Exceptional 52.5% |
| Immigrants | Lithuania | 99.9 /100 | #45 | Exceptional 52.4% |
| Immigrants | Bulgaria | 99.9 /100 | #46 | Exceptional 52.4% |