Cajun vs Ecuadorian Disability Age Under 5
COMPARE
Cajun
Ecuadorian
Disability Age Under 5
Disability Age Under 5 Comparison
Cajuns
Ecuadorians
1.6%
DISABILITY AGE UNDER 5
0.0/ 100
METRIC RATING
298th/ 347
METRIC RANK
1.1%
DISABILITY AGE UNDER 5
99.5/ 100
METRIC RATING
56th/ 347
METRIC RANK
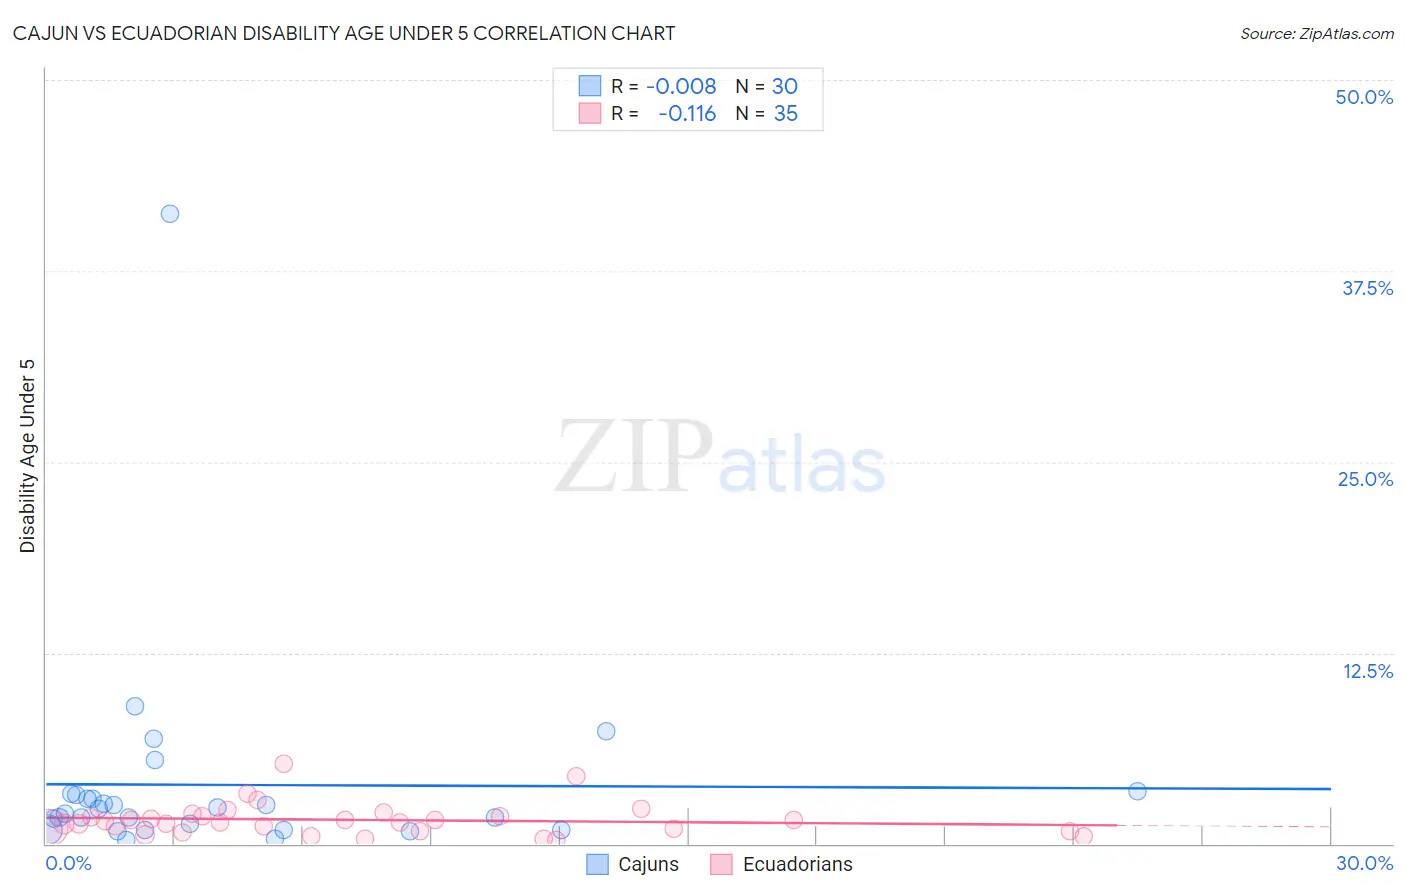
Cajun vs Ecuadorian Disability Age Under 5 Correlation Chart
The statistical analysis conducted on geographies consisting of 103,694,895 people shows no correlation between the proportion of Cajuns and percentage of population with a disability under the age of 5 in the United States with a correlation coefficient (R) of -0.008 and weighted average of 1.6%. Similarly, the statistical analysis conducted on geographies consisting of 186,376,762 people shows a poor negative correlation between the proportion of Ecuadorians and percentage of population with a disability under the age of 5 in the United States with a correlation coefficient (R) of -0.116 and weighted average of 1.1%, a difference of 46.9%.
Disability Age Under 5 Correlation Summary
| Measurement | Cajun | Ecuadorian |
| Minimum | 0.26% | 0.28% |
| Maximum | 41.3% | 5.2% |
| Range | 41.0% | 5.0% |
| Mean | 3.9% | 1.6% |
| Median | 2.1% | 1.4% |
| Interquartile 25% (IQ1) | 0.93% | 0.82% |
| Interquartile 75% (IQ3) | 3.2% | 1.8% |
| Interquartile Range (IQR) | 2.3% | 1.00% |
| Standard Deviation (Sample) | 7.4% | 1.1% |
| Standard Deviation (Population) | 7.2% | 1.1% |
Similar Demographics by Disability Age Under 5
Demographics Similar to Cajuns by Disability Age Under 5
In terms of disability age under 5, the demographic groups most similar to Cajuns are Nonimmigrants (1.6%, a difference of 0.010%), Portuguese (1.6%, a difference of 0.57%), Shoshone (1.6%, a difference of 0.91%), Polish (1.6%, a difference of 0.96%), and Finnish (1.6%, a difference of 1.0%).
| Demographics | Rating | Rank | Disability Age Under 5 |
| Northern Europeans | 0.0 /100 | #291 | Tragic 1.6% |
| Italians | 0.0 /100 | #292 | Tragic 1.6% |
| Lithuanians | 0.0 /100 | #293 | Tragic 1.6% |
| Swedes | 0.0 /100 | #294 | Tragic 1.6% |
| Finns | 0.0 /100 | #295 | Tragic 1.6% |
| Poles | 0.0 /100 | #296 | Tragic 1.6% |
| Immigrants | Nonimmigrants | 0.0 /100 | #297 | Tragic 1.6% |
| Cajuns | 0.0 /100 | #298 | Tragic 1.6% |
| Portuguese | 0.0 /100 | #299 | Tragic 1.6% |
| Shoshone | 0.0 /100 | #300 | Tragic 1.6% |
| German Russians | 0.0 /100 | #301 | Tragic 1.6% |
| Welsh | 0.0 /100 | #302 | Tragic 1.6% |
| Swiss | 0.0 /100 | #303 | Tragic 1.6% |
| Seminole | 0.0 /100 | #304 | Tragic 1.6% |
| Blackfeet | 0.0 /100 | #305 | Tragic 1.6% |
Demographics Similar to Ecuadorians by Disability Age Under 5
In terms of disability age under 5, the demographic groups most similar to Ecuadorians are Assyrian/Chaldean/Syriac (1.1%, a difference of 0.030%), Immigrants from Egypt (1.1%, a difference of 0.22%), Immigrants from Malaysia (1.1%, a difference of 0.33%), Salvadoran (1.1%, a difference of 0.39%), and Immigrants from El Salvador (1.1%, a difference of 0.49%).
| Demographics | Rating | Rank | Disability Age Under 5 |
| Immigrants | Russia | 99.7 /100 | #49 | Exceptional 1.1% |
| Immigrants | Japan | 99.7 /100 | #50 | Exceptional 1.1% |
| Immigrants | Kazakhstan | 99.7 /100 | #51 | Exceptional 1.1% |
| Immigrants | Bolivia | 99.6 /100 | #52 | Exceptional 1.1% |
| Asians | 99.6 /100 | #53 | Exceptional 1.1% |
| Immigrants | El Salvador | 99.6 /100 | #54 | Exceptional 1.1% |
| Salvadorans | 99.5 /100 | #55 | Exceptional 1.1% |
| Ecuadorians | 99.5 /100 | #56 | Exceptional 1.1% |
| Assyrians/Chaldeans/Syriacs | 99.5 /100 | #57 | Exceptional 1.1% |
| Immigrants | Egypt | 99.4 /100 | #58 | Exceptional 1.1% |
| Immigrants | Malaysia | 99.4 /100 | #59 | Exceptional 1.1% |
| Immigrants | Western Asia | 99.2 /100 | #60 | Exceptional 1.1% |
| Immigrants | Ethiopia | 99.2 /100 | #61 | Exceptional 1.1% |
| Immigrants | Switzerland | 99.2 /100 | #62 | Exceptional 1.1% |
| Immigrants | Vietnam | 99.1 /100 | #63 | Exceptional 1.1% |