Cajun vs Carpatho Rusyn Disability Age Under 5
COMPARE
Cajun
Carpatho Rusyn
Disability Age Under 5
Disability Age Under 5 Comparison
Cajuns
Carpatho Rusyns
1.6%
DISABILITY AGE UNDER 5
0.0/ 100
METRIC RATING
298th/ 347
METRIC RANK
1.4%
DISABILITY AGE UNDER 5
0.1/ 100
METRIC RATING
265th/ 347
METRIC RANK
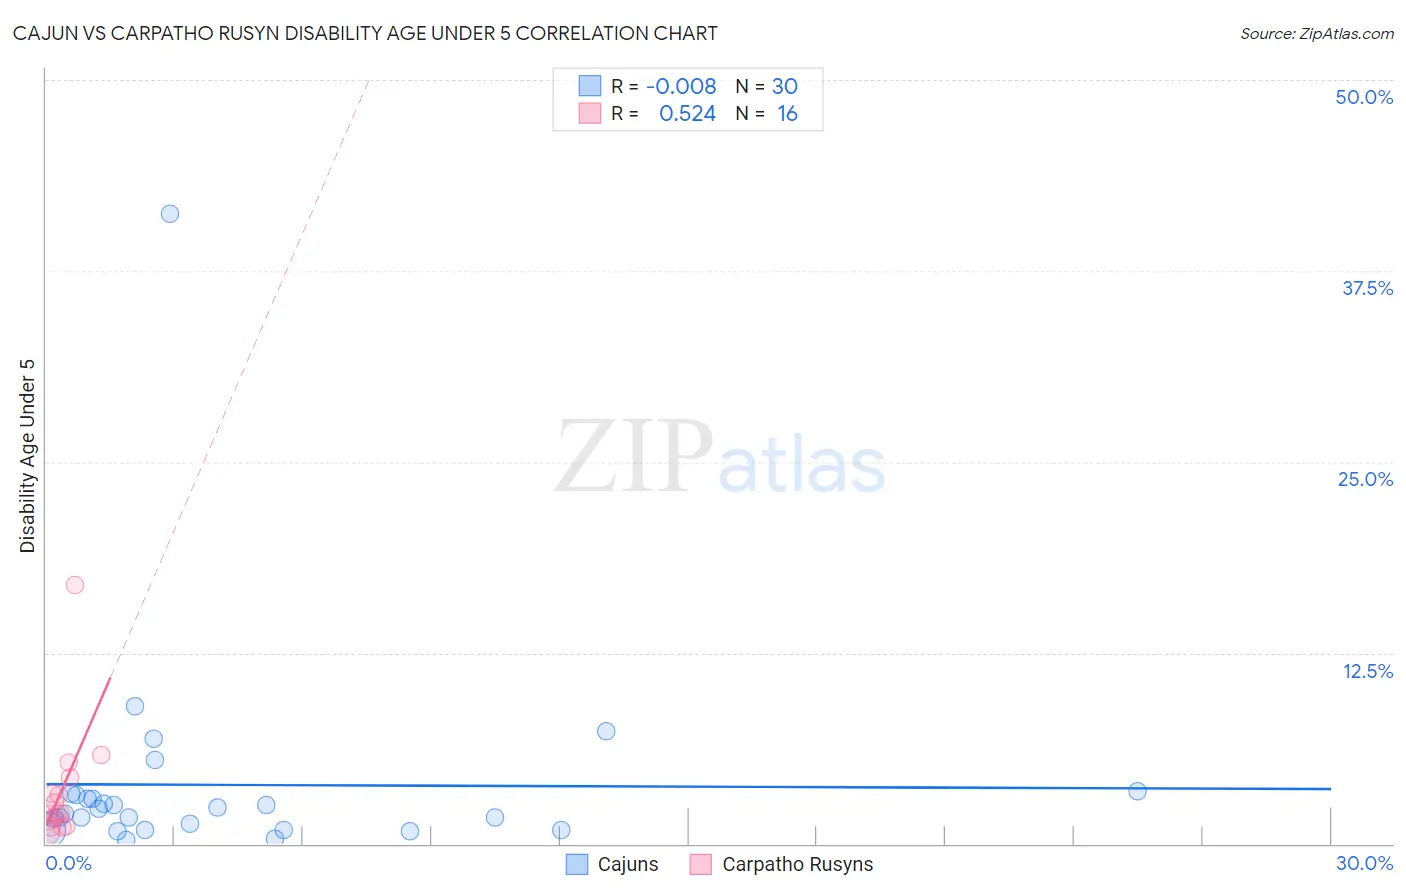
Cajun vs Carpatho Rusyn Disability Age Under 5 Correlation Chart
The statistical analysis conducted on geographies consisting of 103,694,895 people shows no correlation between the proportion of Cajuns and percentage of population with a disability under the age of 5 in the United States with a correlation coefficient (R) of -0.008 and weighted average of 1.6%. Similarly, the statistical analysis conducted on geographies consisting of 46,602,246 people shows a substantial positive correlation between the proportion of Carpatho Rusyns and percentage of population with a disability under the age of 5 in the United States with a correlation coefficient (R) of 0.524 and weighted average of 1.4%, a difference of 12.9%.
Disability Age Under 5 Correlation Summary
| Measurement | Cajun | Carpatho Rusyn |
| Minimum | 0.26% | 0.78% |
| Maximum | 41.3% | 16.9% |
| Range | 41.0% | 16.2% |
| Mean | 3.9% | 3.4% |
| Median | 2.1% | 2.0% |
| Interquartile 25% (IQ1) | 0.93% | 1.3% |
| Interquartile 75% (IQ3) | 3.2% | 3.8% |
| Interquartile Range (IQR) | 2.3% | 2.5% |
| Standard Deviation (Sample) | 7.4% | 3.9% |
| Standard Deviation (Population) | 7.2% | 3.8% |
Similar Demographics by Disability Age Under 5
Demographics Similar to Cajuns by Disability Age Under 5
In terms of disability age under 5, the demographic groups most similar to Cajuns are Nonimmigrants (1.6%, a difference of 0.010%), Portuguese (1.6%, a difference of 0.57%), Shoshone (1.6%, a difference of 0.91%), Polish (1.6%, a difference of 0.96%), and Finnish (1.6%, a difference of 1.0%).
| Demographics | Rating | Rank | Disability Age Under 5 |
| Northern Europeans | 0.0 /100 | #291 | Tragic 1.6% |
| Italians | 0.0 /100 | #292 | Tragic 1.6% |
| Lithuanians | 0.0 /100 | #293 | Tragic 1.6% |
| Swedes | 0.0 /100 | #294 | Tragic 1.6% |
| Finns | 0.0 /100 | #295 | Tragic 1.6% |
| Poles | 0.0 /100 | #296 | Tragic 1.6% |
| Immigrants | Nonimmigrants | 0.0 /100 | #297 | Tragic 1.6% |
| Cajuns | 0.0 /100 | #298 | Tragic 1.6% |
| Portuguese | 0.0 /100 | #299 | Tragic 1.6% |
| Shoshone | 0.0 /100 | #300 | Tragic 1.6% |
| German Russians | 0.0 /100 | #301 | Tragic 1.6% |
| Welsh | 0.0 /100 | #302 | Tragic 1.6% |
| Swiss | 0.0 /100 | #303 | Tragic 1.6% |
| Seminole | 0.0 /100 | #304 | Tragic 1.6% |
| Blackfeet | 0.0 /100 | #305 | Tragic 1.6% |
Demographics Similar to Carpatho Rusyns by Disability Age Under 5
In terms of disability age under 5, the demographic groups most similar to Carpatho Rusyns are Immigrants from Germany (1.4%, a difference of 0.030%), Yugoslavian (1.4%, a difference of 0.040%), Spanish (1.4%, a difference of 0.19%), Immigrants from Dominica (1.4%, a difference of 0.25%), and Immigrants from Netherlands (1.4%, a difference of 0.41%).
| Demographics | Rating | Rank | Disability Age Under 5 |
| Costa Ricans | 0.3 /100 | #258 | Tragic 1.4% |
| Immigrants | Southern Europe | 0.3 /100 | #259 | Tragic 1.4% |
| Slavs | 0.3 /100 | #260 | Tragic 1.4% |
| Immigrants | Netherlands | 0.2 /100 | #261 | Tragic 1.4% |
| Immigrants | Dominica | 0.2 /100 | #262 | Tragic 1.4% |
| Spanish | 0.2 /100 | #263 | Tragic 1.4% |
| Yugoslavians | 0.1 /100 | #264 | Tragic 1.4% |
| Carpatho Rusyns | 0.1 /100 | #265 | Tragic 1.4% |
| Immigrants | Germany | 0.1 /100 | #266 | Tragic 1.4% |
| Cree | 0.1 /100 | #267 | Tragic 1.4% |
| Belgians | 0.1 /100 | #268 | Tragic 1.4% |
| Austrians | 0.1 /100 | #269 | Tragic 1.4% |
| Immigrants | North America | 0.1 /100 | #270 | Tragic 1.4% |
| Immigrants | Canada | 0.1 /100 | #271 | Tragic 1.4% |
| Blacks/African Americans | 0.1 /100 | #272 | Tragic 1.4% |