Immigrants from Uganda vs Ecuadorian Disability Age Under 5
COMPARE
Immigrants from Uganda
Ecuadorian
Disability Age Under 5
Disability Age Under 5 Comparison
Immigrants from Uganda
Ecuadorians
1.1%
DISABILITY AGE UNDER 5
96.1/ 100
METRIC RATING
101st/ 347
METRIC RANK
1.1%
DISABILITY AGE UNDER 5
99.5/ 100
METRIC RATING
56th/ 347
METRIC RANK
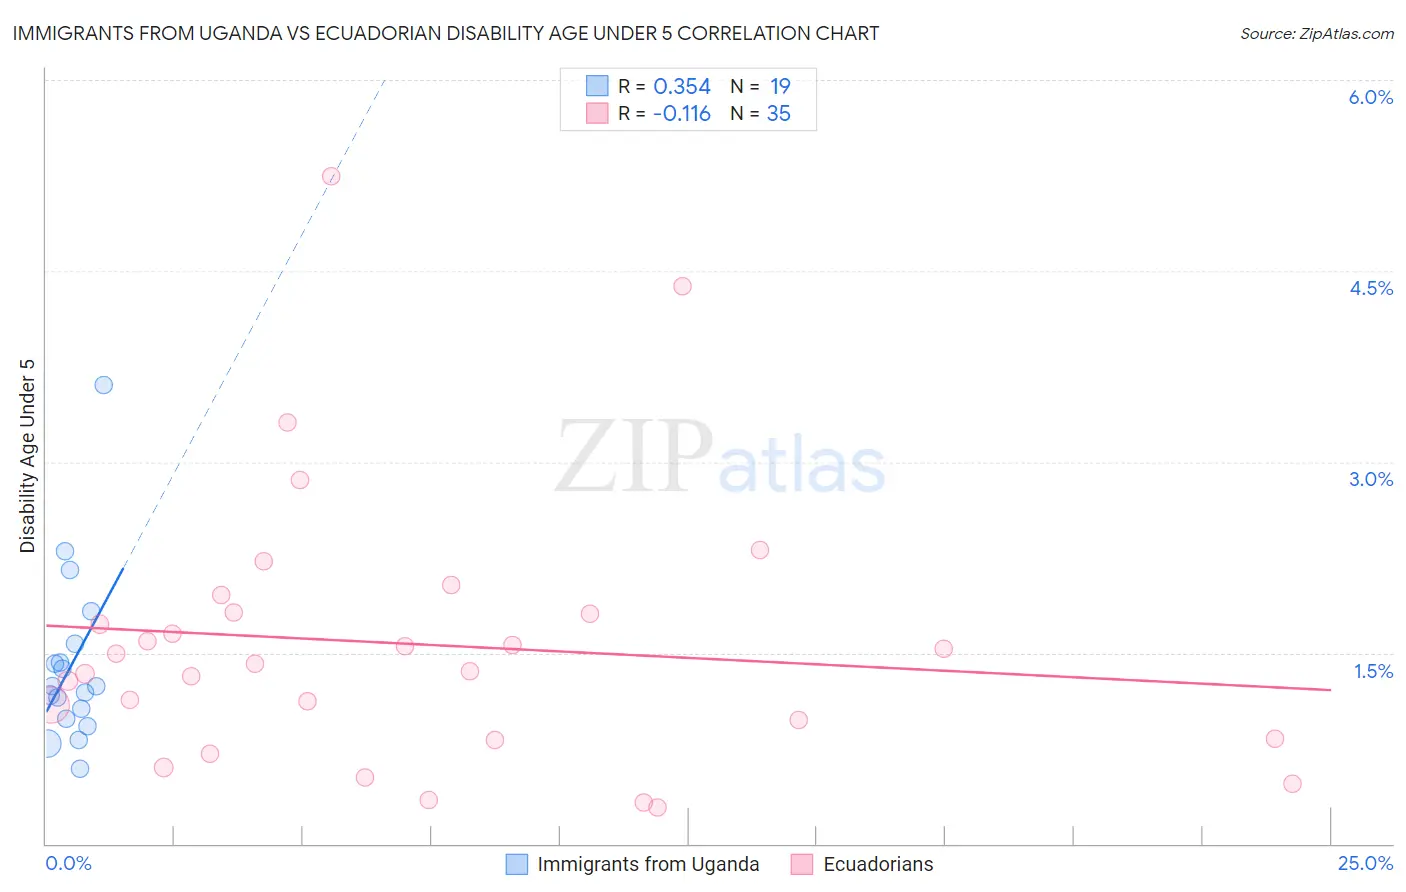
Immigrants from Uganda vs Ecuadorian Disability Age Under 5 Correlation Chart
The statistical analysis conducted on geographies consisting of 93,852,660 people shows a mild positive correlation between the proportion of Immigrants from Uganda and percentage of population with a disability under the age of 5 in the United States with a correlation coefficient (R) of 0.354 and weighted average of 1.1%. Similarly, the statistical analysis conducted on geographies consisting of 186,376,762 people shows a poor negative correlation between the proportion of Ecuadorians and percentage of population with a disability under the age of 5 in the United States with a correlation coefficient (R) of -0.116 and weighted average of 1.1%, a difference of 5.2%.
Disability Age Under 5 Correlation Summary
| Measurement | Immigrants from Uganda | Ecuadorian |
| Minimum | 0.59% | 0.28% |
| Maximum | 3.6% | 5.2% |
| Range | 3.0% | 5.0% |
| Mean | 1.4% | 1.6% |
| Median | 1.2% | 1.4% |
| Interquartile 25% (IQ1) | 0.98% | 0.82% |
| Interquartile 75% (IQ3) | 1.6% | 1.8% |
| Interquartile Range (IQR) | 0.59% | 1.00% |
| Standard Deviation (Sample) | 0.69% | 1.1% |
| Standard Deviation (Population) | 0.67% | 1.1% |
Similar Demographics by Disability Age Under 5
Demographics Similar to Immigrants from Uganda by Disability Age Under 5
In terms of disability age under 5, the demographic groups most similar to Immigrants from Uganda are Immigrants from Morocco (1.2%, a difference of 0.060%), Immigrants from Nicaragua (1.2%, a difference of 0.060%), Nicaraguan (1.1%, a difference of 0.11%), Indonesian (1.2%, a difference of 0.12%), and Dominican (1.1%, a difference of 0.14%).
| Demographics | Rating | Rank | Disability Age Under 5 |
| Sri Lankans | 96.8 /100 | #94 | Exceptional 1.1% |
| Immigrants | Moldova | 96.8 /100 | #95 | Exceptional 1.1% |
| Mongolians | 96.6 /100 | #96 | Exceptional 1.1% |
| Immigrants | Iraq | 96.5 /100 | #97 | Exceptional 1.1% |
| Immigrants | South Eastern Asia | 96.5 /100 | #98 | Exceptional 1.1% |
| Dominicans | 96.3 /100 | #99 | Exceptional 1.1% |
| Nicaraguans | 96.3 /100 | #100 | Exceptional 1.1% |
| Immigrants | Uganda | 96.1 /100 | #101 | Exceptional 1.1% |
| Immigrants | Morocco | 96.0 /100 | #102 | Exceptional 1.2% |
| Immigrants | Nicaragua | 96.0 /100 | #103 | Exceptional 1.2% |
| Indonesians | 95.9 /100 | #104 | Exceptional 1.2% |
| Immigrants | South Africa | 95.6 /100 | #105 | Exceptional 1.2% |
| Cambodians | 95.4 /100 | #106 | Exceptional 1.2% |
| Immigrants | West Indies | 95.3 /100 | #107 | Exceptional 1.2% |
| Iraqis | 95.1 /100 | #108 | Exceptional 1.2% |
Demographics Similar to Ecuadorians by Disability Age Under 5
In terms of disability age under 5, the demographic groups most similar to Ecuadorians are Assyrian/Chaldean/Syriac (1.1%, a difference of 0.030%), Immigrants from Egypt (1.1%, a difference of 0.22%), Immigrants from Malaysia (1.1%, a difference of 0.33%), Salvadoran (1.1%, a difference of 0.39%), and Immigrants from El Salvador (1.1%, a difference of 0.49%).
| Demographics | Rating | Rank | Disability Age Under 5 |
| Immigrants | Russia | 99.7 /100 | #49 | Exceptional 1.1% |
| Immigrants | Japan | 99.7 /100 | #50 | Exceptional 1.1% |
| Immigrants | Kazakhstan | 99.7 /100 | #51 | Exceptional 1.1% |
| Immigrants | Bolivia | 99.6 /100 | #52 | Exceptional 1.1% |
| Asians | 99.6 /100 | #53 | Exceptional 1.1% |
| Immigrants | El Salvador | 99.6 /100 | #54 | Exceptional 1.1% |
| Salvadorans | 99.5 /100 | #55 | Exceptional 1.1% |
| Ecuadorians | 99.5 /100 | #56 | Exceptional 1.1% |
| Assyrians/Chaldeans/Syriacs | 99.5 /100 | #57 | Exceptional 1.1% |
| Immigrants | Egypt | 99.4 /100 | #58 | Exceptional 1.1% |
| Immigrants | Malaysia | 99.4 /100 | #59 | Exceptional 1.1% |
| Immigrants | Western Asia | 99.2 /100 | #60 | Exceptional 1.1% |
| Immigrants | Ethiopia | 99.2 /100 | #61 | Exceptional 1.1% |
| Immigrants | Switzerland | 99.2 /100 | #62 | Exceptional 1.1% |
| Immigrants | Vietnam | 99.1 /100 | #63 | Exceptional 1.1% |