Immigrants from Denmark vs Ecuadorian Disability Age Under 5
COMPARE
Immigrants from Denmark
Ecuadorian
Disability Age Under 5
Disability Age Under 5 Comparison
Immigrants from Denmark
Ecuadorians
1.1%
DISABILITY AGE UNDER 5
98.1/ 100
METRIC RATING
77th/ 347
METRIC RANK
1.1%
DISABILITY AGE UNDER 5
99.5/ 100
METRIC RATING
56th/ 347
METRIC RANK
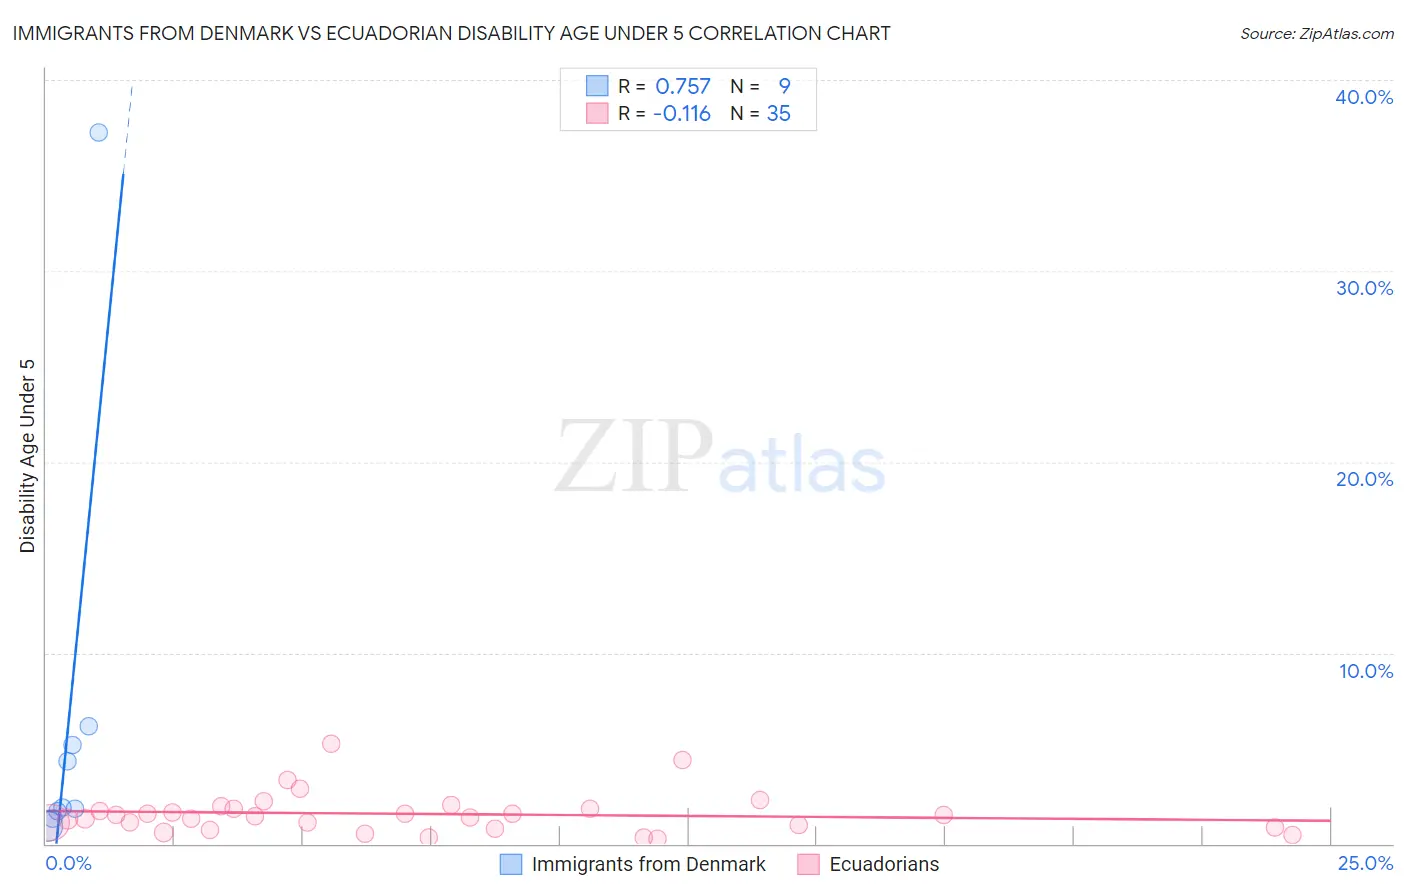
Immigrants from Denmark vs Ecuadorian Disability Age Under 5 Correlation Chart
The statistical analysis conducted on geographies consisting of 97,246,779 people shows a strong positive correlation between the proportion of Immigrants from Denmark and percentage of population with a disability under the age of 5 in the United States with a correlation coefficient (R) of 0.757 and weighted average of 1.1%. Similarly, the statistical analysis conducted on geographies consisting of 186,376,762 people shows a poor negative correlation between the proportion of Ecuadorians and percentage of population with a disability under the age of 5 in the United States with a correlation coefficient (R) of -0.116 and weighted average of 1.1%, a difference of 3.3%.
Disability Age Under 5 Correlation Summary
| Measurement | Immigrants from Denmark | Ecuadorian |
| Minimum | 0.89% | 0.28% |
| Maximum | 37.3% | 5.2% |
| Range | 36.4% | 5.0% |
| Mean | 6.7% | 1.6% |
| Median | 1.9% | 1.4% |
| Interquartile 25% (IQ1) | 1.5% | 0.82% |
| Interquartile 75% (IQ3) | 5.7% | 1.8% |
| Interquartile Range (IQR) | 4.1% | 1.00% |
| Standard Deviation (Sample) | 11.6% | 1.1% |
| Standard Deviation (Population) | 10.9% | 1.1% |
Similar Demographics by Disability Age Under 5
Demographics Similar to Immigrants from Denmark by Disability Age Under 5
In terms of disability age under 5, the demographic groups most similar to Immigrants from Denmark are West Indian (1.1%, a difference of 0.12%), Immigrants from Burma/Myanmar (1.1%, a difference of 0.14%), Hmong (1.1%, a difference of 0.14%), Immigrants from Trinidad and Tobago (1.1%, a difference of 0.16%), and Turkish (1.1%, a difference of 0.18%).
| Demographics | Rating | Rank | Disability Age Under 5 |
| Immigrants | Ecuador | 98.6 /100 | #70 | Exceptional 1.1% |
| Trinidadians and Tobagonians | 98.6 /100 | #71 | Exceptional 1.1% |
| Burmese | 98.5 /100 | #72 | Exceptional 1.1% |
| Immigrants | Sri Lanka | 98.5 /100 | #73 | Exceptional 1.1% |
| Jordanians | 98.5 /100 | #74 | Exceptional 1.1% |
| Immigrants | Pakistan | 98.4 /100 | #75 | Exceptional 1.1% |
| Immigrants | Burma/Myanmar | 98.2 /100 | #76 | Exceptional 1.1% |
| Immigrants | Denmark | 98.1 /100 | #77 | Exceptional 1.1% |
| West Indians | 98.0 /100 | #78 | Exceptional 1.1% |
| Hmong | 98.0 /100 | #79 | Exceptional 1.1% |
| Immigrants | Trinidad and Tobago | 98.0 /100 | #80 | Exceptional 1.1% |
| Turks | 98.0 /100 | #81 | Exceptional 1.1% |
| Immigrants | Jordan | 97.9 /100 | #82 | Exceptional 1.1% |
| Immigrants | Syria | 97.9 /100 | #83 | Exceptional 1.1% |
| Immigrants | Zaire | 97.8 /100 | #84 | Exceptional 1.1% |
Demographics Similar to Ecuadorians by Disability Age Under 5
In terms of disability age under 5, the demographic groups most similar to Ecuadorians are Assyrian/Chaldean/Syriac (1.1%, a difference of 0.030%), Immigrants from Egypt (1.1%, a difference of 0.22%), Immigrants from Malaysia (1.1%, a difference of 0.33%), Salvadoran (1.1%, a difference of 0.39%), and Immigrants from El Salvador (1.1%, a difference of 0.49%).
| Demographics | Rating | Rank | Disability Age Under 5 |
| Immigrants | Russia | 99.7 /100 | #49 | Exceptional 1.1% |
| Immigrants | Japan | 99.7 /100 | #50 | Exceptional 1.1% |
| Immigrants | Kazakhstan | 99.7 /100 | #51 | Exceptional 1.1% |
| Immigrants | Bolivia | 99.6 /100 | #52 | Exceptional 1.1% |
| Asians | 99.6 /100 | #53 | Exceptional 1.1% |
| Immigrants | El Salvador | 99.6 /100 | #54 | Exceptional 1.1% |
| Salvadorans | 99.5 /100 | #55 | Exceptional 1.1% |
| Ecuadorians | 99.5 /100 | #56 | Exceptional 1.1% |
| Assyrians/Chaldeans/Syriacs | 99.5 /100 | #57 | Exceptional 1.1% |
| Immigrants | Egypt | 99.4 /100 | #58 | Exceptional 1.1% |
| Immigrants | Malaysia | 99.4 /100 | #59 | Exceptional 1.1% |
| Immigrants | Western Asia | 99.2 /100 | #60 | Exceptional 1.1% |
| Immigrants | Ethiopia | 99.2 /100 | #61 | Exceptional 1.1% |
| Immigrants | Switzerland | 99.2 /100 | #62 | Exceptional 1.1% |
| Immigrants | Vietnam | 99.1 /100 | #63 | Exceptional 1.1% |