Irish vs Immigrants from Honduras Vision Disability
COMPARE
Irish
Immigrants from Honduras
Vision Disability
Vision Disability Comparison
Irish
Immigrants from Honduras
2.3%
VISION DISABILITY
3.4/ 100
METRIC RATING
224th/ 347
METRIC RANK
2.5%
VISION DISABILITY
0.0/ 100
METRIC RATING
291st/ 347
METRIC RANK
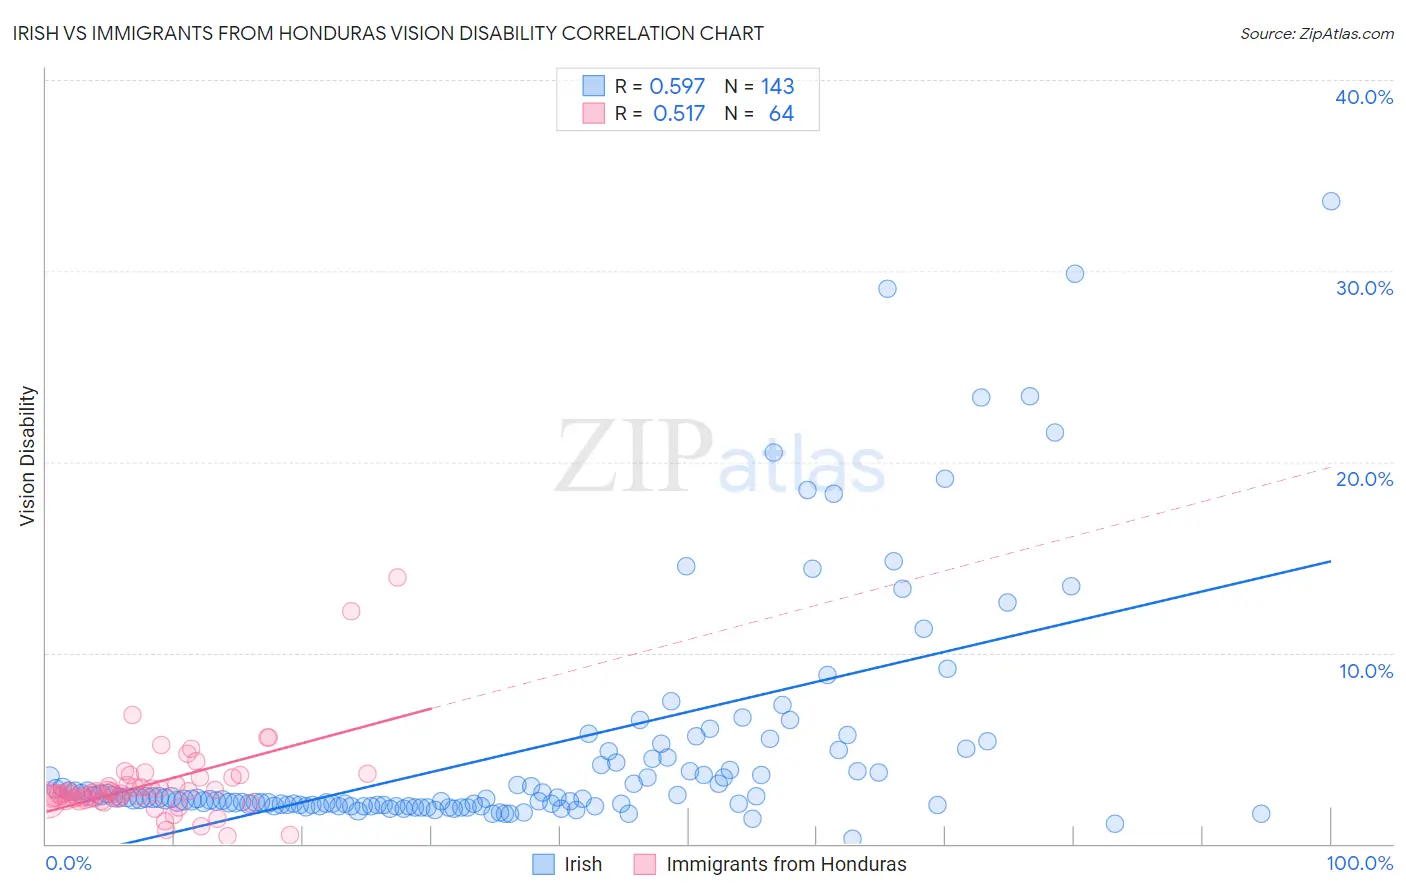
Irish vs Immigrants from Honduras Vision Disability Correlation Chart
The statistical analysis conducted on geographies consisting of 577,659,989 people shows a substantial positive correlation between the proportion of Irish and percentage of population with vision disability in the United States with a correlation coefficient (R) of 0.597 and weighted average of 2.3%. Similarly, the statistical analysis conducted on geographies consisting of 322,475,782 people shows a substantial positive correlation between the proportion of Immigrants from Honduras and percentage of population with vision disability in the United States with a correlation coefficient (R) of 0.517 and weighted average of 2.5%, a difference of 9.3%.
Vision Disability Correlation Summary
| Measurement | Irish | Immigrants from Honduras |
| Minimum | 0.27% | 0.42% |
| Maximum | 33.6% | 14.0% |
| Range | 33.4% | 13.5% |
| Mean | 4.9% | 3.1% |
| Median | 2.4% | 2.6% |
| Interquartile 25% (IQ1) | 2.0% | 2.3% |
| Interquartile 75% (IQ3) | 4.4% | 3.3% |
| Interquartile Range (IQR) | 2.4% | 0.94% |
| Standard Deviation (Sample) | 6.0% | 2.1% |
| Standard Deviation (Population) | 6.0% | 2.1% |
Similar Demographics by Vision Disability
Demographics Similar to Irish by Vision Disability
In terms of vision disability, the demographic groups most similar to Irish are Immigrants from Western Africa (2.3%, a difference of 0.010%), Basque (2.3%, a difference of 0.020%), Immigrants from Senegal (2.3%, a difference of 0.17%), French Canadian (2.3%, a difference of 0.19%), and Guamanian/Chamorro (2.3%, a difference of 0.20%).
| Demographics | Rating | Rank | Vision Disability |
| Barbadians | 5.1 /100 | #217 | Tragic 2.3% |
| Portuguese | 4.9 /100 | #218 | Tragic 2.3% |
| Ecuadorians | 4.6 /100 | #219 | Tragic 2.3% |
| Guamanians/Chamorros | 3.9 /100 | #220 | Tragic 2.3% |
| French Canadians | 3.9 /100 | #221 | Tragic 2.3% |
| Immigrants | Senegal | 3.8 /100 | #222 | Tragic 2.3% |
| Basques | 3.5 /100 | #223 | Tragic 2.3% |
| Irish | 3.4 /100 | #224 | Tragic 2.3% |
| Immigrants | Western Africa | 3.4 /100 | #225 | Tragic 2.3% |
| Immigrants | Germany | 3.0 /100 | #226 | Tragic 2.3% |
| Hawaiians | 2.9 /100 | #227 | Tragic 2.3% |
| Hmong | 2.5 /100 | #228 | Tragic 2.3% |
| Welsh | 2.3 /100 | #229 | Tragic 2.3% |
| Nicaraguans | 2.2 /100 | #230 | Tragic 2.3% |
| Immigrants | Ecuador | 2.0 /100 | #231 | Tragic 2.3% |
Demographics Similar to Immigrants from Honduras by Vision Disability
In terms of vision disability, the demographic groups most similar to Immigrants from Honduras are Crow (2.5%, a difference of 0.10%), Yaqui (2.5%, a difference of 0.12%), Immigrants from Cuba (2.5%, a difference of 0.39%), Ottawa (2.5%, a difference of 0.46%), and Nonimmigrants (2.5%, a difference of 0.53%).
| Demographics | Rating | Rank | Vision Disability |
| Yakama | 0.0 /100 | #284 | Tragic 2.5% |
| Immigrants | Central America | 0.0 /100 | #285 | Tragic 2.5% |
| Sioux | 0.0 /100 | #286 | Tragic 2.5% |
| Hondurans | 0.0 /100 | #287 | Tragic 2.5% |
| French American Indians | 0.0 /100 | #288 | Tragic 2.5% |
| Immigrants | Nonimmigrants | 0.0 /100 | #289 | Tragic 2.5% |
| Immigrants | Cuba | 0.0 /100 | #290 | Tragic 2.5% |
| Immigrants | Honduras | 0.0 /100 | #291 | Tragic 2.5% |
| Crow | 0.0 /100 | #292 | Tragic 2.5% |
| Yaqui | 0.0 /100 | #293 | Tragic 2.5% |
| Ottawa | 0.0 /100 | #294 | Tragic 2.5% |
| Delaware | 0.0 /100 | #295 | Tragic 2.5% |
| Immigrants | Mexico | 0.0 /100 | #296 | Tragic 2.5% |
| Immigrants | Dominica | 0.0 /100 | #297 | Tragic 2.5% |
| Mexicans | 0.0 /100 | #298 | Tragic 2.5% |