Guatemalan vs Immigrants from Honduras Vision Disability
COMPARE
Guatemalan
Immigrants from Honduras
Vision Disability
Vision Disability Comparison
Guatemalans
Immigrants from Honduras
2.3%
VISION DISABILITY
0.5/ 100
METRIC RATING
247th/ 347
METRIC RANK
2.5%
VISION DISABILITY
0.0/ 100
METRIC RATING
291st/ 347
METRIC RANK
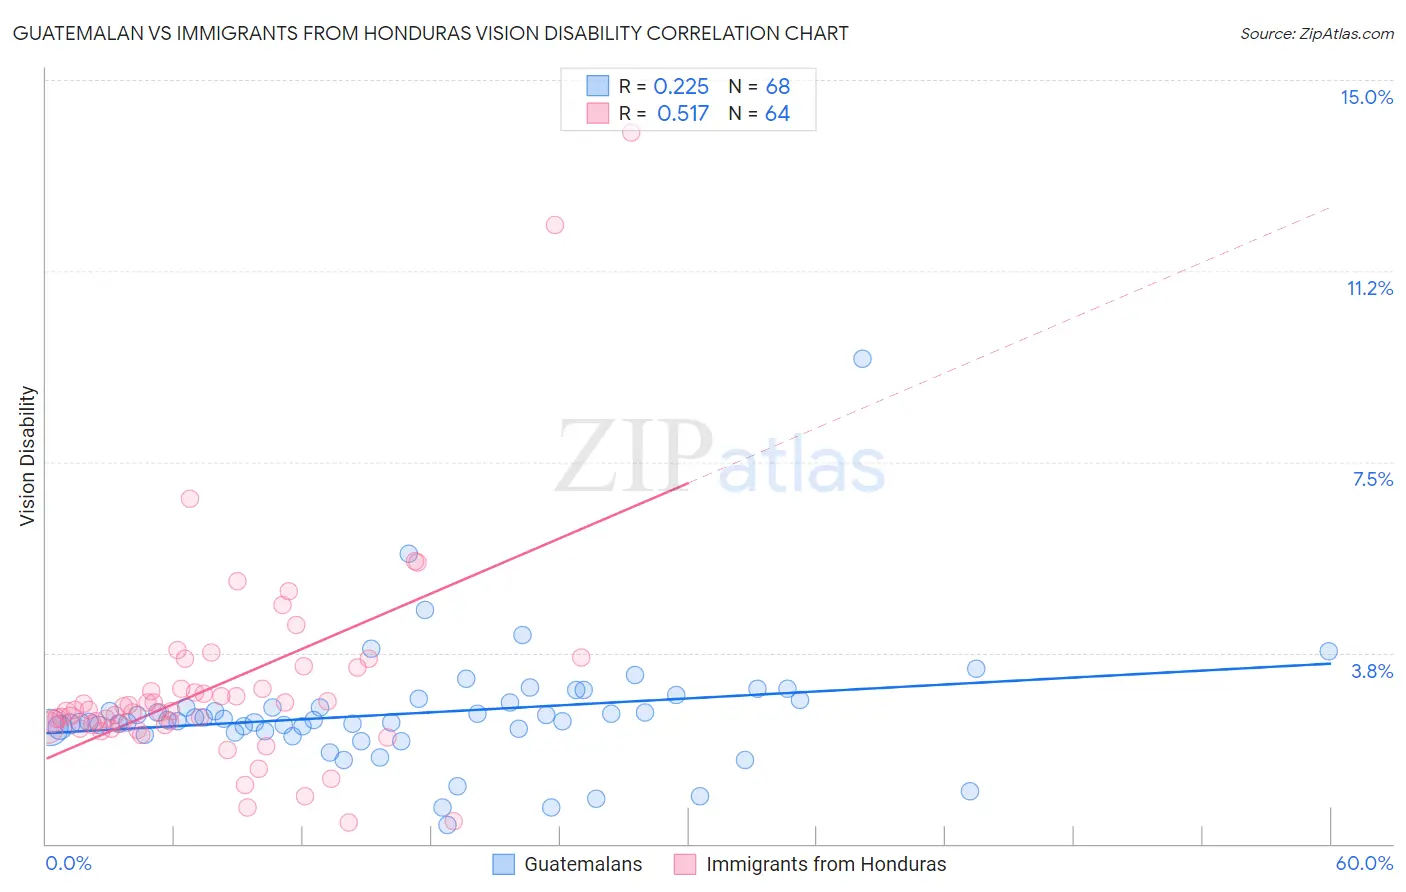
Guatemalan vs Immigrants from Honduras Vision Disability Correlation Chart
The statistical analysis conducted on geographies consisting of 409,275,877 people shows a weak positive correlation between the proportion of Guatemalans and percentage of population with vision disability in the United States with a correlation coefficient (R) of 0.225 and weighted average of 2.3%. Similarly, the statistical analysis conducted on geographies consisting of 322,475,782 people shows a substantial positive correlation between the proportion of Immigrants from Honduras and percentage of population with vision disability in the United States with a correlation coefficient (R) of 0.517 and weighted average of 2.5%, a difference of 6.2%.
Vision Disability Correlation Summary
| Measurement | Guatemalan | Immigrants from Honduras |
| Minimum | 0.37% | 0.42% |
| Maximum | 9.5% | 14.0% |
| Range | 9.2% | 13.5% |
| Mean | 2.6% | 3.1% |
| Median | 2.4% | 2.6% |
| Interquartile 25% (IQ1) | 2.2% | 2.3% |
| Interquartile 75% (IQ3) | 2.8% | 3.3% |
| Interquartile Range (IQR) | 0.57% | 0.94% |
| Standard Deviation (Sample) | 1.2% | 2.1% |
| Standard Deviation (Population) | 1.2% | 2.1% |
Similar Demographics by Vision Disability
Demographics Similar to Guatemalans by Vision Disability
In terms of vision disability, the demographic groups most similar to Guatemalans are Subsaharan African (2.3%, a difference of 0.020%), Liberian (2.3%, a difference of 0.030%), French (2.3%, a difference of 0.040%), Bangladeshi (2.3%, a difference of 0.12%), and Alsatian (2.3%, a difference of 0.19%).
| Demographics | Rating | Rank | Vision Disability |
| Panamanians | 0.9 /100 | #240 | Tragic 2.3% |
| Malaysians | 0.9 /100 | #241 | Tragic 2.3% |
| Immigrants | Panama | 0.8 /100 | #242 | Tragic 2.3% |
| Immigrants | Nicaragua | 0.6 /100 | #243 | Tragic 2.3% |
| Immigrants | West Indies | 0.6 /100 | #244 | Tragic 2.3% |
| Alsatians | 0.6 /100 | #245 | Tragic 2.3% |
| French | 0.5 /100 | #246 | Tragic 2.3% |
| Guatemalans | 0.5 /100 | #247 | Tragic 2.3% |
| Sub-Saharan Africans | 0.5 /100 | #248 | Tragic 2.3% |
| Liberians | 0.5 /100 | #249 | Tragic 2.3% |
| Bangladeshis | 0.5 /100 | #250 | Tragic 2.3% |
| Immigrants | Laos | 0.4 /100 | #251 | Tragic 2.4% |
| Immigrants | Micronesia | 0.3 /100 | #252 | Tragic 2.4% |
| Japanese | 0.3 /100 | #253 | Tragic 2.4% |
| Haitians | 0.3 /100 | #254 | Tragic 2.4% |
Demographics Similar to Immigrants from Honduras by Vision Disability
In terms of vision disability, the demographic groups most similar to Immigrants from Honduras are Crow (2.5%, a difference of 0.10%), Yaqui (2.5%, a difference of 0.12%), Immigrants from Cuba (2.5%, a difference of 0.39%), Ottawa (2.5%, a difference of 0.46%), and Nonimmigrants (2.5%, a difference of 0.53%).
| Demographics | Rating | Rank | Vision Disability |
| Yakama | 0.0 /100 | #284 | Tragic 2.5% |
| Immigrants | Central America | 0.0 /100 | #285 | Tragic 2.5% |
| Sioux | 0.0 /100 | #286 | Tragic 2.5% |
| Hondurans | 0.0 /100 | #287 | Tragic 2.5% |
| French American Indians | 0.0 /100 | #288 | Tragic 2.5% |
| Immigrants | Nonimmigrants | 0.0 /100 | #289 | Tragic 2.5% |
| Immigrants | Cuba | 0.0 /100 | #290 | Tragic 2.5% |
| Immigrants | Honduras | 0.0 /100 | #291 | Tragic 2.5% |
| Crow | 0.0 /100 | #292 | Tragic 2.5% |
| Yaqui | 0.0 /100 | #293 | Tragic 2.5% |
| Ottawa | 0.0 /100 | #294 | Tragic 2.5% |
| Delaware | 0.0 /100 | #295 | Tragic 2.5% |
| Immigrants | Mexico | 0.0 /100 | #296 | Tragic 2.5% |
| Immigrants | Dominica | 0.0 /100 | #297 | Tragic 2.5% |
| Mexicans | 0.0 /100 | #298 | Tragic 2.5% |