Assyrian/Chaldean/Syriac vs Immigrants from Honduras Vision Disability
COMPARE
Assyrian/Chaldean/Syriac
Immigrants from Honduras
Vision Disability
Vision Disability Comparison
Assyrians/Chaldeans/Syriacs
Immigrants from Honduras
2.0%
VISION DISABILITY
98.1/ 100
METRIC RATING
79th/ 347
METRIC RANK
2.5%
VISION DISABILITY
0.0/ 100
METRIC RATING
291st/ 347
METRIC RANK
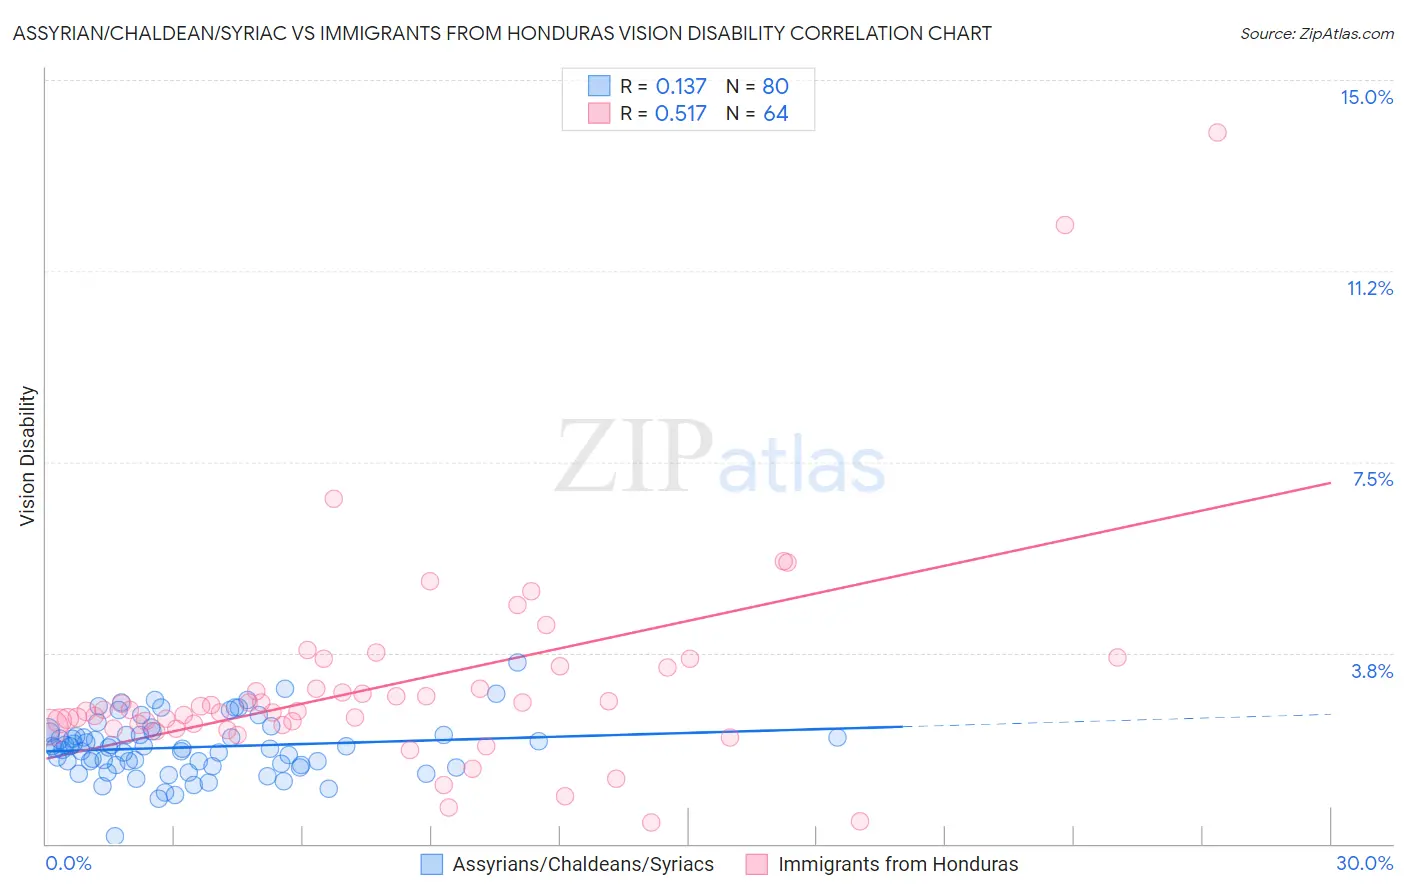
Assyrian/Chaldean/Syriac vs Immigrants from Honduras Vision Disability Correlation Chart
The statistical analysis conducted on geographies consisting of 110,300,168 people shows a poor positive correlation between the proportion of Assyrians/Chaldeans/Syriacs and percentage of population with vision disability in the United States with a correlation coefficient (R) of 0.137 and weighted average of 2.0%. Similarly, the statistical analysis conducted on geographies consisting of 322,475,782 people shows a substantial positive correlation between the proportion of Immigrants from Honduras and percentage of population with vision disability in the United States with a correlation coefficient (R) of 0.517 and weighted average of 2.5%, a difference of 22.7%.
Vision Disability Correlation Summary
| Measurement | Assyrian/Chaldean/Syriac | Immigrants from Honduras |
| Minimum | 0.15% | 0.42% |
| Maximum | 3.6% | 14.0% |
| Range | 3.4% | 13.5% |
| Mean | 1.9% | 3.1% |
| Median | 1.9% | 2.6% |
| Interquartile 25% (IQ1) | 1.6% | 2.3% |
| Interquartile 75% (IQ3) | 2.2% | 3.3% |
| Interquartile Range (IQR) | 0.61% | 0.94% |
| Standard Deviation (Sample) | 0.57% | 2.1% |
| Standard Deviation (Population) | 0.56% | 2.1% |
Similar Demographics by Vision Disability
Demographics Similar to Assyrians/Chaldeans/Syriacs by Vision Disability
In terms of vision disability, the demographic groups most similar to Assyrians/Chaldeans/Syriacs are Immigrants from Eastern Europe (2.0%, a difference of 0.18%), Paraguayan (2.0%, a difference of 0.21%), Immigrants from Jordan (2.0%, a difference of 0.21%), Palestinian (2.0%, a difference of 0.23%), and Immigrants from North Macedonia (2.0%, a difference of 0.23%).
| Demographics | Rating | Rank | Vision Disability |
| Immigrants | France | 98.5 /100 | #72 | Exceptional 2.0% |
| Immigrants | Eritrea | 98.4 /100 | #73 | Exceptional 2.0% |
| Palestinians | 98.3 /100 | #74 | Exceptional 2.0% |
| Immigrants | North Macedonia | 98.3 /100 | #75 | Exceptional 2.0% |
| Paraguayans | 98.3 /100 | #76 | Exceptional 2.0% |
| Immigrants | Jordan | 98.3 /100 | #77 | Exceptional 2.0% |
| Immigrants | Eastern Europe | 98.3 /100 | #78 | Exceptional 2.0% |
| Assyrians/Chaldeans/Syriacs | 98.1 /100 | #79 | Exceptional 2.0% |
| Lithuanians | 97.7 /100 | #80 | Exceptional 2.0% |
| Soviet Union | 97.6 /100 | #81 | Exceptional 2.0% |
| Immigrants | Poland | 97.6 /100 | #82 | Exceptional 2.0% |
| Immigrants | Western Asia | 97.5 /100 | #83 | Exceptional 2.0% |
| Immigrants | Latvia | 97.3 /100 | #84 | Exceptional 2.0% |
| Chinese | 97.2 /100 | #85 | Exceptional 2.0% |
| Immigrants | Moldova | 97.2 /100 | #86 | Exceptional 2.0% |
Demographics Similar to Immigrants from Honduras by Vision Disability
In terms of vision disability, the demographic groups most similar to Immigrants from Honduras are Crow (2.5%, a difference of 0.10%), Yaqui (2.5%, a difference of 0.12%), Immigrants from Cuba (2.5%, a difference of 0.39%), Ottawa (2.5%, a difference of 0.46%), and Nonimmigrants (2.5%, a difference of 0.53%).
| Demographics | Rating | Rank | Vision Disability |
| Yakama | 0.0 /100 | #284 | Tragic 2.5% |
| Immigrants | Central America | 0.0 /100 | #285 | Tragic 2.5% |
| Sioux | 0.0 /100 | #286 | Tragic 2.5% |
| Hondurans | 0.0 /100 | #287 | Tragic 2.5% |
| French American Indians | 0.0 /100 | #288 | Tragic 2.5% |
| Immigrants | Nonimmigrants | 0.0 /100 | #289 | Tragic 2.5% |
| Immigrants | Cuba | 0.0 /100 | #290 | Tragic 2.5% |
| Immigrants | Honduras | 0.0 /100 | #291 | Tragic 2.5% |
| Crow | 0.0 /100 | #292 | Tragic 2.5% |
| Yaqui | 0.0 /100 | #293 | Tragic 2.5% |
| Ottawa | 0.0 /100 | #294 | Tragic 2.5% |
| Delaware | 0.0 /100 | #295 | Tragic 2.5% |
| Immigrants | Mexico | 0.0 /100 | #296 | Tragic 2.5% |
| Immigrants | Dominica | 0.0 /100 | #297 | Tragic 2.5% |
| Mexicans | 0.0 /100 | #298 | Tragic 2.5% |