Immigrants from Egypt vs Immigrants from Honduras Vision Disability
COMPARE
Immigrants from Egypt
Immigrants from Honduras
Vision Disability
Vision Disability Comparison
Immigrants from Egypt
Immigrants from Honduras
1.9%
VISION DISABILITY
99.9/ 100
METRIC RATING
33rd/ 347
METRIC RANK
2.5%
VISION DISABILITY
0.0/ 100
METRIC RATING
291st/ 347
METRIC RANK
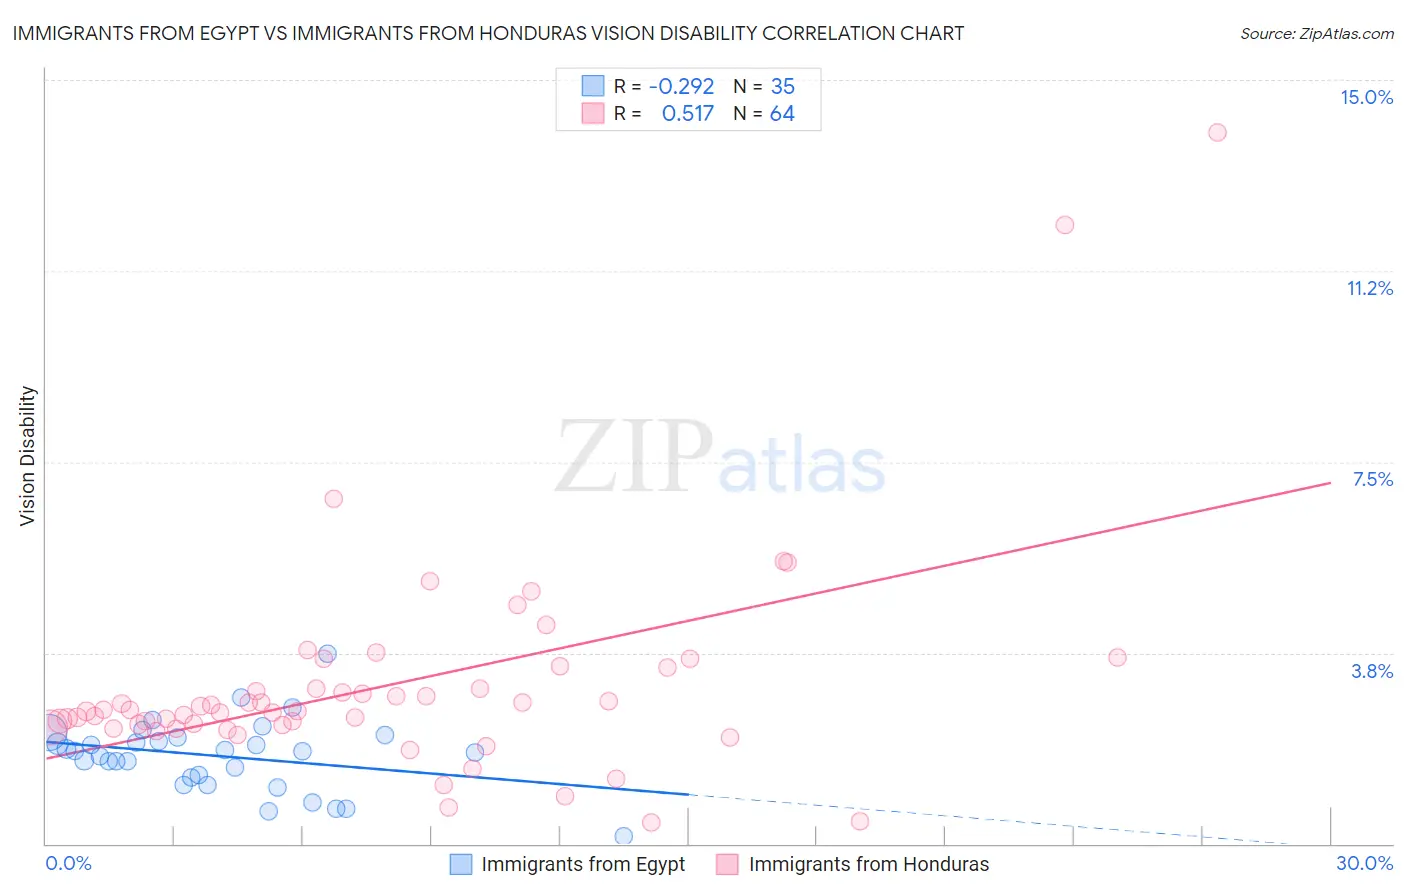
Immigrants from Egypt vs Immigrants from Honduras Vision Disability Correlation Chart
The statistical analysis conducted on geographies consisting of 245,409,407 people shows a weak negative correlation between the proportion of Immigrants from Egypt and percentage of population with vision disability in the United States with a correlation coefficient (R) of -0.292 and weighted average of 1.9%. Similarly, the statistical analysis conducted on geographies consisting of 322,475,782 people shows a substantial positive correlation between the proportion of Immigrants from Honduras and percentage of population with vision disability in the United States with a correlation coefficient (R) of 0.517 and weighted average of 2.5%, a difference of 28.2%.
Vision Disability Correlation Summary
| Measurement | Immigrants from Egypt | Immigrants from Honduras |
| Minimum | 0.14% | 0.42% |
| Maximum | 3.7% | 14.0% |
| Range | 3.6% | 13.5% |
| Mean | 1.7% | 3.1% |
| Median | 1.8% | 2.6% |
| Interquartile 25% (IQ1) | 1.3% | 2.3% |
| Interquartile 75% (IQ3) | 2.1% | 3.3% |
| Interquartile Range (IQR) | 0.78% | 0.94% |
| Standard Deviation (Sample) | 0.69% | 2.1% |
| Standard Deviation (Population) | 0.68% | 2.1% |
Similar Demographics by Vision Disability
Demographics Similar to Immigrants from Egypt by Vision Disability
In terms of vision disability, the demographic groups most similar to Immigrants from Egypt are Immigrants from Turkey (1.9%, a difference of 0.13%), Immigrants from Australia (1.9%, a difference of 0.22%), Luxembourger (1.9%, a difference of 0.31%), Cambodian (2.0%, a difference of 0.57%), and Mongolian (1.9%, a difference of 0.58%).
| Demographics | Rating | Rank | Vision Disability |
| Immigrants | Japan | 99.9 /100 | #26 | Exceptional 1.9% |
| Taiwanese | 99.9 /100 | #27 | Exceptional 1.9% |
| Immigrants | Malaysia | 99.9 /100 | #28 | Exceptional 1.9% |
| Egyptians | 99.9 /100 | #29 | Exceptional 1.9% |
| Immigrants | Nepal | 99.9 /100 | #30 | Exceptional 1.9% |
| Mongolians | 99.9 /100 | #31 | Exceptional 1.9% |
| Luxembourgers | 99.9 /100 | #32 | Exceptional 1.9% |
| Immigrants | Egypt | 99.9 /100 | #33 | Exceptional 1.9% |
| Immigrants | Turkey | 99.8 /100 | #34 | Exceptional 1.9% |
| Immigrants | Australia | 99.8 /100 | #35 | Exceptional 1.9% |
| Cambodians | 99.8 /100 | #36 | Exceptional 2.0% |
| Bhutanese | 99.8 /100 | #37 | Exceptional 2.0% |
| Immigrants | Kuwait | 99.8 /100 | #38 | Exceptional 2.0% |
| Zimbabweans | 99.7 /100 | #39 | Exceptional 2.0% |
| Immigrants | Ireland | 99.7 /100 | #40 | Exceptional 2.0% |
Demographics Similar to Immigrants from Honduras by Vision Disability
In terms of vision disability, the demographic groups most similar to Immigrants from Honduras are Crow (2.5%, a difference of 0.10%), Yaqui (2.5%, a difference of 0.12%), Immigrants from Cuba (2.5%, a difference of 0.39%), Ottawa (2.5%, a difference of 0.46%), and Nonimmigrants (2.5%, a difference of 0.53%).
| Demographics | Rating | Rank | Vision Disability |
| Yakama | 0.0 /100 | #284 | Tragic 2.5% |
| Immigrants | Central America | 0.0 /100 | #285 | Tragic 2.5% |
| Sioux | 0.0 /100 | #286 | Tragic 2.5% |
| Hondurans | 0.0 /100 | #287 | Tragic 2.5% |
| French American Indians | 0.0 /100 | #288 | Tragic 2.5% |
| Immigrants | Nonimmigrants | 0.0 /100 | #289 | Tragic 2.5% |
| Immigrants | Cuba | 0.0 /100 | #290 | Tragic 2.5% |
| Immigrants | Honduras | 0.0 /100 | #291 | Tragic 2.5% |
| Crow | 0.0 /100 | #292 | Tragic 2.5% |
| Yaqui | 0.0 /100 | #293 | Tragic 2.5% |
| Ottawa | 0.0 /100 | #294 | Tragic 2.5% |
| Delaware | 0.0 /100 | #295 | Tragic 2.5% |
| Immigrants | Mexico | 0.0 /100 | #296 | Tragic 2.5% |
| Immigrants | Dominica | 0.0 /100 | #297 | Tragic 2.5% |
| Mexicans | 0.0 /100 | #298 | Tragic 2.5% |