Burmese vs Immigrants from Honduras Disability Age 18 to 34
COMPARE
Burmese
Immigrants from Honduras
Disability Age 18 to 34
Disability Age 18 to 34 Comparison
Burmese
Immigrants from Honduras
6.0%
DISABILITY AGE 18 TO 34
99.5/ 100
METRIC RATING
66th/ 347
METRIC RANK
6.4%
DISABILITY AGE 18 TO 34
87.7/ 100
METRIC RATING
137th/ 347
METRIC RANK
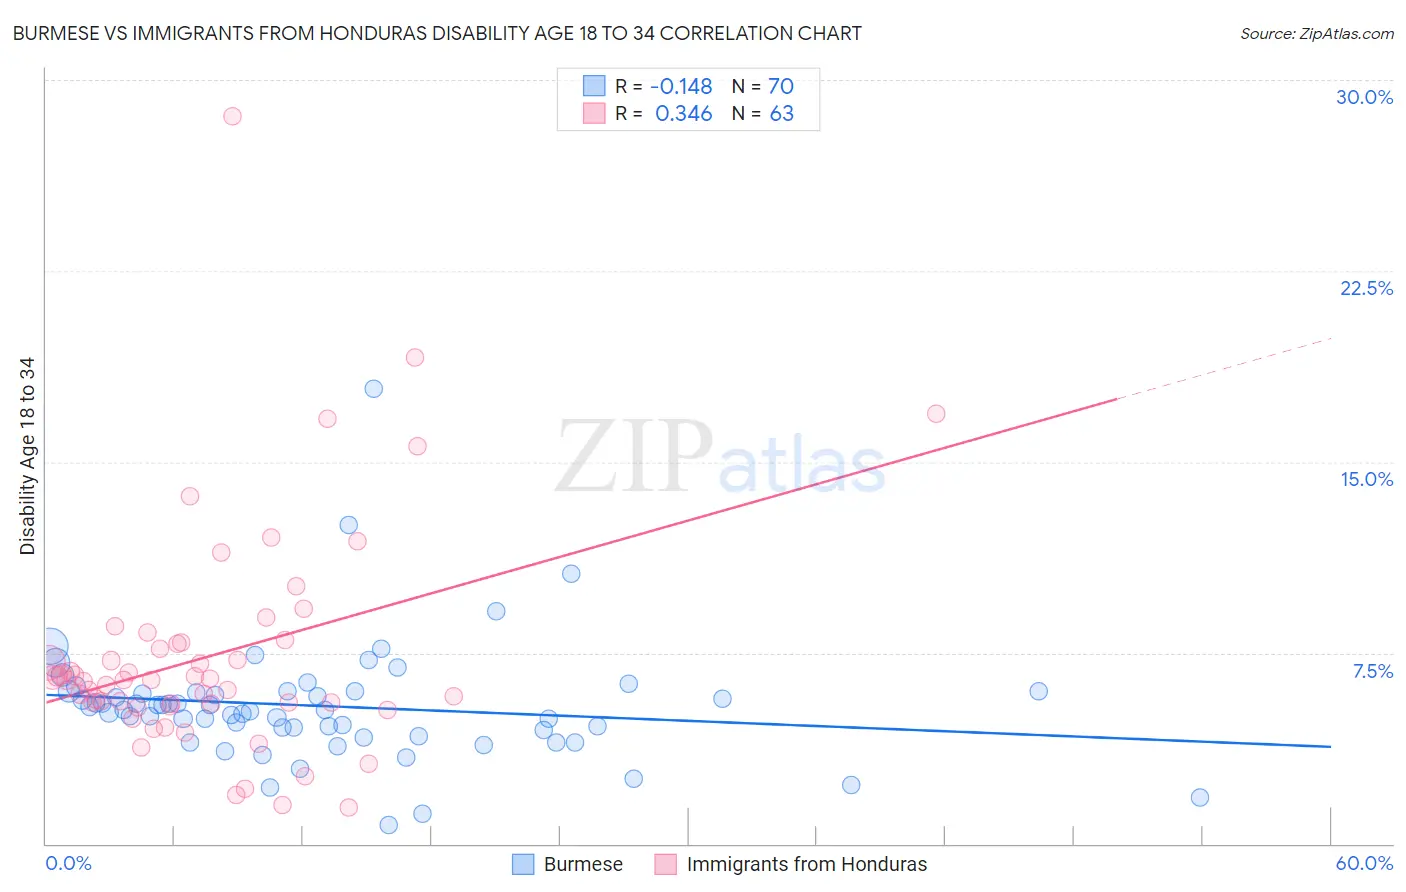
Burmese vs Immigrants from Honduras Disability Age 18 to 34 Correlation Chart
The statistical analysis conducted on geographies consisting of 464,073,050 people shows a poor negative correlation between the proportion of Burmese and percentage of population with a disability between the ages 18 and 35 in the United States with a correlation coefficient (R) of -0.148 and weighted average of 6.0%. Similarly, the statistical analysis conducted on geographies consisting of 322,187,149 people shows a mild positive correlation between the proportion of Immigrants from Honduras and percentage of population with a disability between the ages 18 and 35 in the United States with a correlation coefficient (R) of 0.346 and weighted average of 6.4%, a difference of 6.4%.
Disability Age 18 to 34 Correlation Summary
| Measurement | Burmese | Immigrants from Honduras |
| Minimum | 0.73% | 1.4% |
| Maximum | 17.9% | 28.6% |
| Range | 17.1% | 27.2% |
| Mean | 5.4% | 7.4% |
| Median | 5.3% | 6.4% |
| Interquartile 25% (IQ1) | 4.5% | 5.5% |
| Interquartile 75% (IQ3) | 6.0% | 7.9% |
| Interquartile Range (IQR) | 1.5% | 2.4% |
| Standard Deviation (Sample) | 2.4% | 4.4% |
| Standard Deviation (Population) | 2.4% | 4.4% |
Similar Demographics by Disability Age 18 to 34
Demographics Similar to Burmese by Disability Age 18 to 34
In terms of disability age 18 to 34, the demographic groups most similar to Burmese are Immigrants from North Macedonia (6.0%, a difference of 0.040%), Immigrants from Poland (6.0%, a difference of 0.10%), Trinidadian and Tobagonian (6.0%, a difference of 0.14%), Taiwanese (6.0%, a difference of 0.28%), and Salvadoran (6.0%, a difference of 0.29%).
| Demographics | Rating | Rank | Disability Age 18 to 34 |
| Immigrants | Caribbean | 99.6 /100 | #59 | Exceptional 6.0% |
| Immigrants | Sri Lanka | 99.6 /100 | #60 | Exceptional 6.0% |
| British West Indians | 99.6 /100 | #61 | Exceptional 6.0% |
| Peruvians | 99.6 /100 | #62 | Exceptional 6.0% |
| Salvadorans | 99.6 /100 | #63 | Exceptional 6.0% |
| Taiwanese | 99.6 /100 | #64 | Exceptional 6.0% |
| Trinidadians and Tobagonians | 99.5 /100 | #65 | Exceptional 6.0% |
| Burmese | 99.5 /100 | #66 | Exceptional 6.0% |
| Immigrants | North Macedonia | 99.5 /100 | #67 | Exceptional 6.0% |
| Immigrants | Poland | 99.5 /100 | #68 | Exceptional 6.0% |
| Immigrants | West Indies | 99.4 /100 | #69 | Exceptional 6.0% |
| Immigrants | Greece | 99.4 /100 | #70 | Exceptional 6.0% |
| Immigrants | Japan | 99.3 /100 | #71 | Exceptional 6.0% |
| Immigrants | Lebanon | 99.2 /100 | #72 | Exceptional 6.0% |
| Cypriots | 99.2 /100 | #73 | Exceptional 6.0% |
Demographics Similar to Immigrants from Honduras by Disability Age 18 to 34
In terms of disability age 18 to 34, the demographic groups most similar to Immigrants from Honduras are Spanish American Indian (6.4%, a difference of 0.0%), Immigrants from Belize (6.4%, a difference of 0.050%), Immigrants from Fiji (6.4%, a difference of 0.070%), Immigrants from Sweden (6.4%, a difference of 0.13%), and Palestinian (6.4%, a difference of 0.14%).
| Demographics | Rating | Rank | Disability Age 18 to 34 |
| Immigrants | Dominica | 90.5 /100 | #130 | Exceptional 6.3% |
| Immigrants | Saudi Arabia | 90.4 /100 | #131 | Exceptional 6.3% |
| Guatemalans | 89.6 /100 | #132 | Excellent 6.4% |
| Brazilians | 89.0 /100 | #133 | Excellent 6.4% |
| Immigrants | Europe | 88.8 /100 | #134 | Excellent 6.4% |
| Palestinians | 88.5 /100 | #135 | Excellent 6.4% |
| Immigrants | Sweden | 88.5 /100 | #136 | Excellent 6.4% |
| Immigrants | Honduras | 87.7 /100 | #137 | Excellent 6.4% |
| Spanish American Indians | 87.7 /100 | #138 | Excellent 6.4% |
| Immigrants | Belize | 87.4 /100 | #139 | Excellent 6.4% |
| Immigrants | Fiji | 87.3 /100 | #140 | Excellent 6.4% |
| Jamaicans | 86.8 /100 | #141 | Excellent 6.4% |
| South American Indians | 86.5 /100 | #142 | Excellent 6.4% |
| Immigrants | Latvia | 86.4 /100 | #143 | Excellent 6.4% |
| Albanians | 85.3 /100 | #144 | Excellent 6.4% |