Bulgarian vs Immigrants from Asia Hearing Disability
COMPARE
Bulgarian
Immigrants from Asia
Hearing Disability
Hearing Disability Comparison
Bulgarians
Immigrants from Asia
3.0%
HEARING DISABILITY
39.7/ 100
METRIC RATING
183rd/ 347
METRIC RANK
2.7%
HEARING DISABILITY
97.2/ 100
METRIC RATING
80th/ 347
METRIC RANK
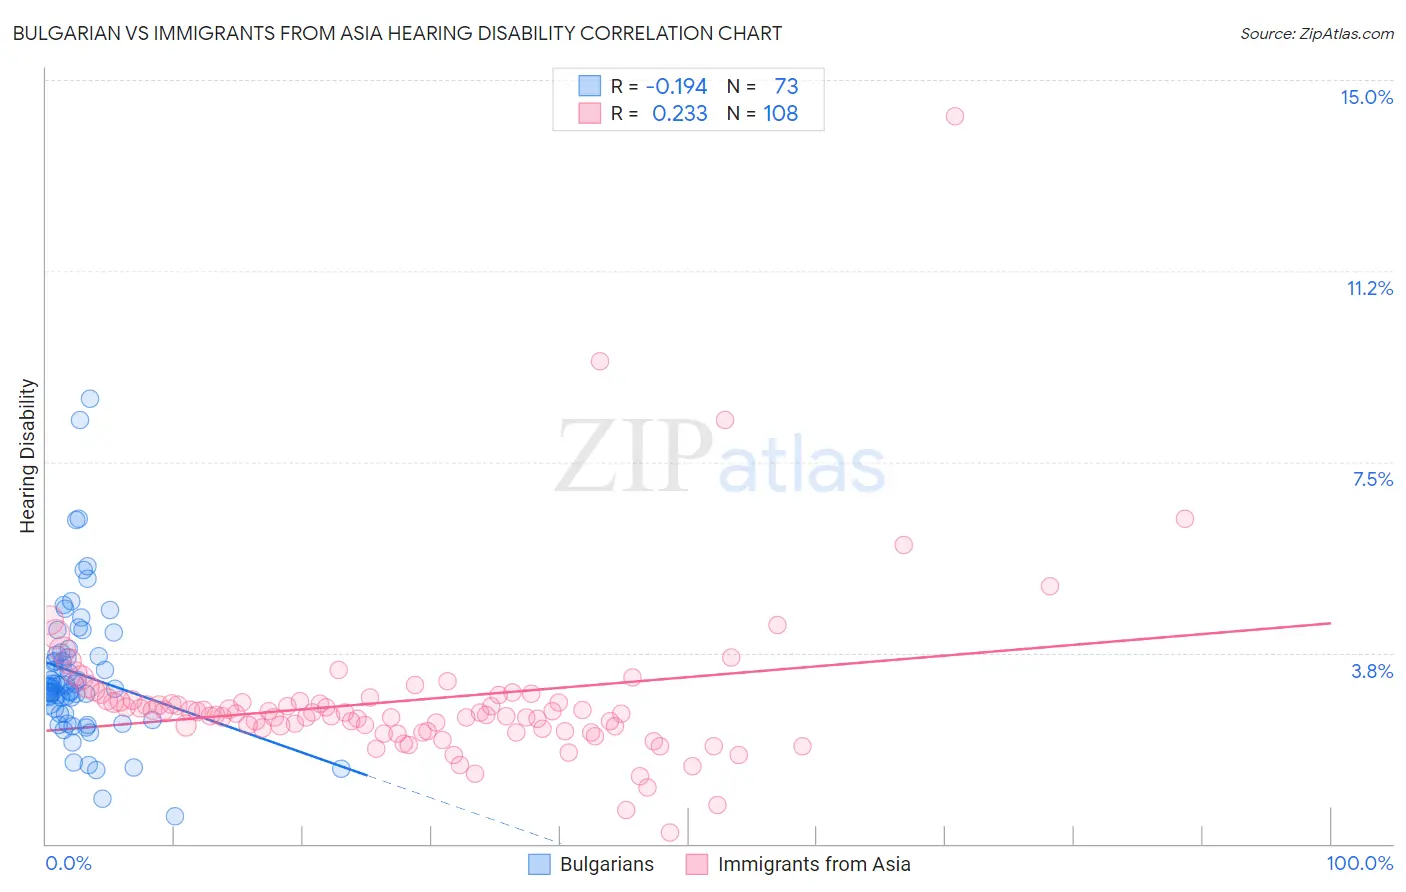
Bulgarian vs Immigrants from Asia Hearing Disability Correlation Chart
The statistical analysis conducted on geographies consisting of 205,610,417 people shows a poor negative correlation between the proportion of Bulgarians and percentage of population with hearing disability in the United States with a correlation coefficient (R) of -0.194 and weighted average of 3.0%. Similarly, the statistical analysis conducted on geographies consisting of 548,612,138 people shows a weak positive correlation between the proportion of Immigrants from Asia and percentage of population with hearing disability in the United States with a correlation coefficient (R) of 0.233 and weighted average of 2.7%, a difference of 10.2%.
Hearing Disability Correlation Summary
| Measurement | Bulgarian | Immigrants from Asia |
| Minimum | 0.54% | 0.21% |
| Maximum | 8.7% | 14.3% |
| Range | 8.2% | 14.1% |
| Mean | 3.3% | 2.8% |
| Median | 3.1% | 2.6% |
| Interquartile 25% (IQ1) | 2.5% | 2.2% |
| Interquartile 75% (IQ3) | 3.7% | 2.8% |
| Interquartile Range (IQR) | 1.2% | 0.58% |
| Standard Deviation (Sample) | 1.4% | 1.6% |
| Standard Deviation (Population) | 1.4% | 1.6% |
Similar Demographics by Hearing Disability
Demographics Similar to Bulgarians by Hearing Disability
In terms of hearing disability, the demographic groups most similar to Bulgarians are Immigrants from Italy (3.0%, a difference of 0.14%), Immigrants from Belgium (3.0%, a difference of 0.17%), Immigrants from Ireland (3.0%, a difference of 0.23%), Immigrants from Sweden (3.0%, a difference of 0.26%), and Immigrants from Moldova (3.0%, a difference of 0.32%).
| Demographics | Rating | Rank | Hearing Disability |
| Panamanians | 47.0 /100 | #176 | Average 3.0% |
| Immigrants | Philippines | 46.4 /100 | #177 | Average 3.0% |
| Japanese | 46.0 /100 | #178 | Average 3.0% |
| Immigrants | Moldova | 43.1 /100 | #179 | Average 3.0% |
| Immigrants | Sweden | 42.4 /100 | #180 | Average 3.0% |
| Immigrants | Belgium | 41.5 /100 | #181 | Average 3.0% |
| Immigrants | Italy | 41.1 /100 | #182 | Average 3.0% |
| Bulgarians | 39.7 /100 | #183 | Fair 3.0% |
| Immigrants | Ireland | 37.4 /100 | #184 | Fair 3.0% |
| Immigrants | Southern Europe | 35.3 /100 | #185 | Fair 3.0% |
| Immigrants | Mexico | 34.9 /100 | #186 | Fair 3.0% |
| Blacks/African Americans | 34.7 /100 | #187 | Fair 3.0% |
| Mexican American Indians | 34.7 /100 | #188 | Fair 3.0% |
| Africans | 32.9 /100 | #189 | Fair 3.0% |
| Immigrants | South Africa | 31.1 /100 | #190 | Fair 3.1% |
Demographics Similar to Immigrants from Asia by Hearing Disability
In terms of hearing disability, the demographic groups most similar to Immigrants from Asia are Immigrants from Uruguay (2.7%, a difference of 0.030%), Immigrants from Armenia (2.7%, a difference of 0.050%), Immigrants from Cuba (2.7%, a difference of 0.060%), Colombian (2.7%, a difference of 0.18%), and Mongolian (2.7%, a difference of 0.20%).
| Demographics | Rating | Rank | Hearing Disability |
| Argentineans | 97.5 /100 | #73 | Exceptional 2.7% |
| Immigrants | Korea | 97.5 /100 | #74 | Exceptional 2.7% |
| Immigrants | Saudi Arabia | 97.5 /100 | #75 | Exceptional 2.7% |
| Asians | 97.5 /100 | #76 | Exceptional 2.7% |
| Immigrants | Malaysia | 97.5 /100 | #77 | Exceptional 2.7% |
| Mongolians | 97.4 /100 | #78 | Exceptional 2.7% |
| Colombians | 97.4 /100 | #79 | Exceptional 2.7% |
| Immigrants | Asia | 97.2 /100 | #80 | Exceptional 2.7% |
| Immigrants | Uruguay | 97.2 /100 | #81 | Exceptional 2.7% |
| Immigrants | Armenia | 97.2 /100 | #82 | Exceptional 2.7% |
| Immigrants | Cuba | 97.2 /100 | #83 | Exceptional 2.7% |
| Immigrants | Argentina | 97.0 /100 | #84 | Exceptional 2.8% |
| Immigrants | Northern Africa | 96.9 /100 | #85 | Exceptional 2.8% |
| Immigrants | Iran | 96.8 /100 | #86 | Exceptional 2.8% |
| Somalis | 96.7 /100 | #87 | Exceptional 2.8% |