Bulgarian vs Italian Hearing Disability
COMPARE
Bulgarian
Italian
Hearing Disability
Hearing Disability Comparison
Bulgarians
Italians
3.0%
HEARING DISABILITY
39.7/ 100
METRIC RATING
183rd/ 347
METRIC RANK
3.4%
HEARING DISABILITY
0.4/ 100
METRIC RATING
249th/ 347
METRIC RANK
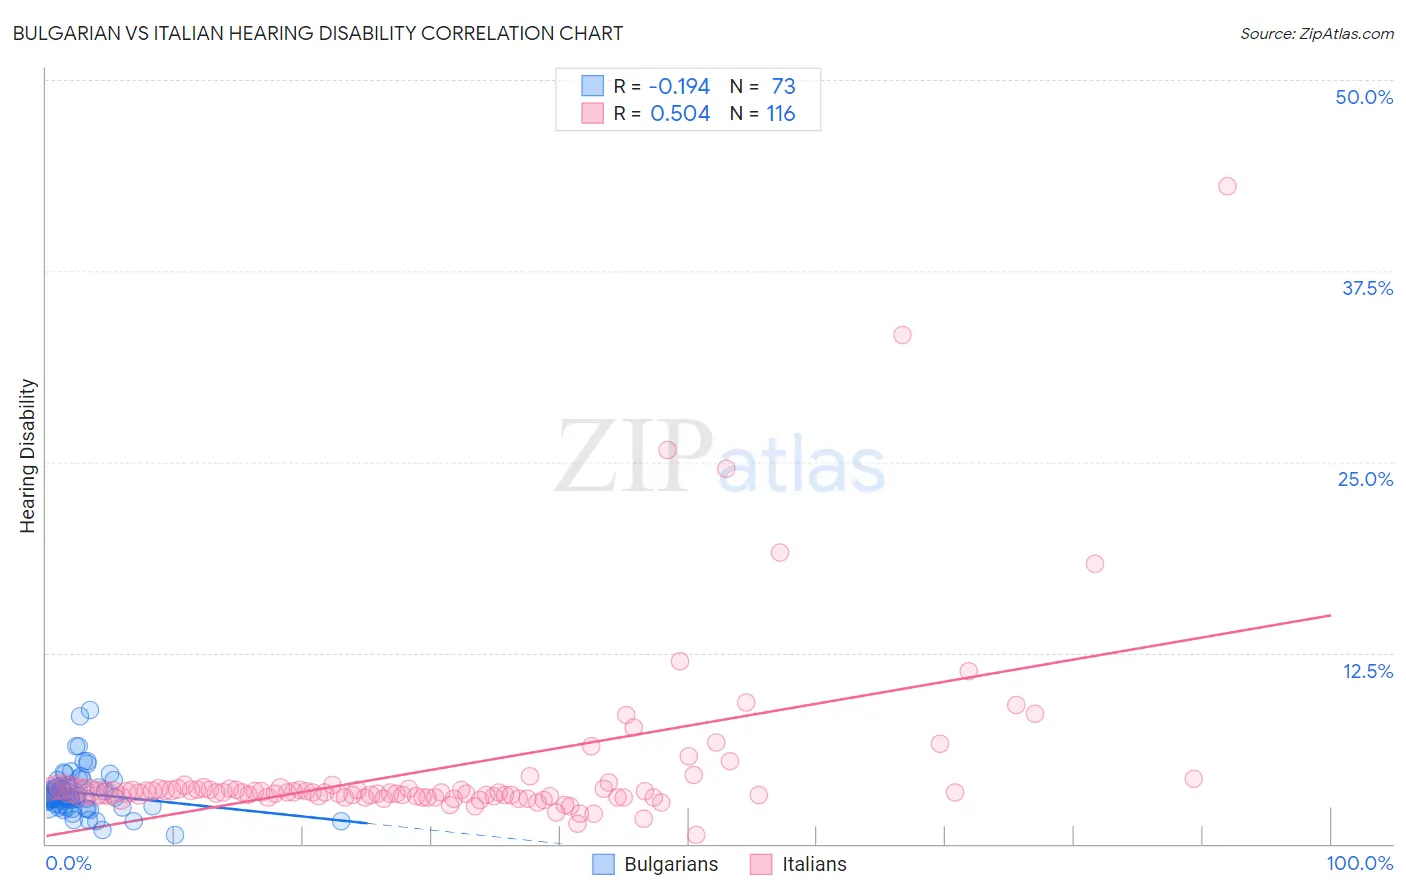
Bulgarian vs Italian Hearing Disability Correlation Chart
The statistical analysis conducted on geographies consisting of 205,610,417 people shows a poor negative correlation between the proportion of Bulgarians and percentage of population with hearing disability in the United States with a correlation coefficient (R) of -0.194 and weighted average of 3.0%. Similarly, the statistical analysis conducted on geographies consisting of 574,261,406 people shows a substantial positive correlation between the proportion of Italians and percentage of population with hearing disability in the United States with a correlation coefficient (R) of 0.504 and weighted average of 3.4%, a difference of 11.6%.
Hearing Disability Correlation Summary
| Measurement | Bulgarian | Italian |
| Minimum | 0.54% | 0.61% |
| Maximum | 8.7% | 43.0% |
| Range | 8.2% | 42.4% |
| Mean | 3.3% | 5.0% |
| Median | 3.1% | 3.4% |
| Interquartile 25% (IQ1) | 2.5% | 3.1% |
| Interquartile 75% (IQ3) | 3.7% | 3.6% |
| Interquartile Range (IQR) | 1.2% | 0.52% |
| Standard Deviation (Sample) | 1.4% | 5.9% |
| Standard Deviation (Population) | 1.4% | 5.8% |
Similar Demographics by Hearing Disability
Demographics Similar to Bulgarians by Hearing Disability
In terms of hearing disability, the demographic groups most similar to Bulgarians are Immigrants from Italy (3.0%, a difference of 0.14%), Immigrants from Belgium (3.0%, a difference of 0.17%), Immigrants from Ireland (3.0%, a difference of 0.23%), Immigrants from Sweden (3.0%, a difference of 0.26%), and Immigrants from Moldova (3.0%, a difference of 0.32%).
| Demographics | Rating | Rank | Hearing Disability |
| Panamanians | 47.0 /100 | #176 | Average 3.0% |
| Immigrants | Philippines | 46.4 /100 | #177 | Average 3.0% |
| Japanese | 46.0 /100 | #178 | Average 3.0% |
| Immigrants | Moldova | 43.1 /100 | #179 | Average 3.0% |
| Immigrants | Sweden | 42.4 /100 | #180 | Average 3.0% |
| Immigrants | Belgium | 41.5 /100 | #181 | Average 3.0% |
| Immigrants | Italy | 41.1 /100 | #182 | Average 3.0% |
| Bulgarians | 39.7 /100 | #183 | Fair 3.0% |
| Immigrants | Ireland | 37.4 /100 | #184 | Fair 3.0% |
| Immigrants | Southern Europe | 35.3 /100 | #185 | Fair 3.0% |
| Immigrants | Mexico | 34.9 /100 | #186 | Fair 3.0% |
| Blacks/African Americans | 34.7 /100 | #187 | Fair 3.0% |
| Mexican American Indians | 34.7 /100 | #188 | Fair 3.0% |
| Africans | 32.9 /100 | #189 | Fair 3.0% |
| Immigrants | South Africa | 31.1 /100 | #190 | Fair 3.1% |
Demographics Similar to Italians by Hearing Disability
In terms of hearing disability, the demographic groups most similar to Italians are Yuman (3.4%, a difference of 0.010%), Hungarian (3.4%, a difference of 0.24%), Croatian (3.4%, a difference of 0.45%), Austrian (3.4%, a difference of 0.53%), and Lithuanian (3.4%, a difference of 0.75%).
| Demographics | Rating | Rank | Hearing Disability |
| Yugoslavians | 1.0 /100 | #242 | Tragic 3.3% |
| Immigrants | Western Europe | 1.0 /100 | #243 | Tragic 3.3% |
| Assyrians/Chaldeans/Syriacs | 0.9 /100 | #244 | Tragic 3.3% |
| Immigrants | Scotland | 0.8 /100 | #245 | Tragic 3.3% |
| Immigrants | England | 0.7 /100 | #246 | Tragic 3.3% |
| Lithuanians | 0.6 /100 | #247 | Tragic 3.4% |
| Austrians | 0.6 /100 | #248 | Tragic 3.4% |
| Italians | 0.4 /100 | #249 | Tragic 3.4% |
| Yuman | 0.4 /100 | #250 | Tragic 3.4% |
| Hungarians | 0.4 /100 | #251 | Tragic 3.4% |
| Croatians | 0.4 /100 | #252 | Tragic 3.4% |
| Carpatho Rusyns | 0.3 /100 | #253 | Tragic 3.4% |
| Slavs | 0.2 /100 | #254 | Tragic 3.4% |
| Poles | 0.2 /100 | #255 | Tragic 3.4% |
| Hmong | 0.2 /100 | #256 | Tragic 3.4% |