Bulgarian vs Hopi Hearing Disability
COMPARE
Bulgarian
Hopi
Hearing Disability
Hearing Disability Comparison
Bulgarians
Hopi
3.0%
HEARING DISABILITY
39.7/ 100
METRIC RATING
183rd/ 347
METRIC RANK
3.9%
HEARING DISABILITY
0.0/ 100
METRIC RATING
313th/ 347
METRIC RANK
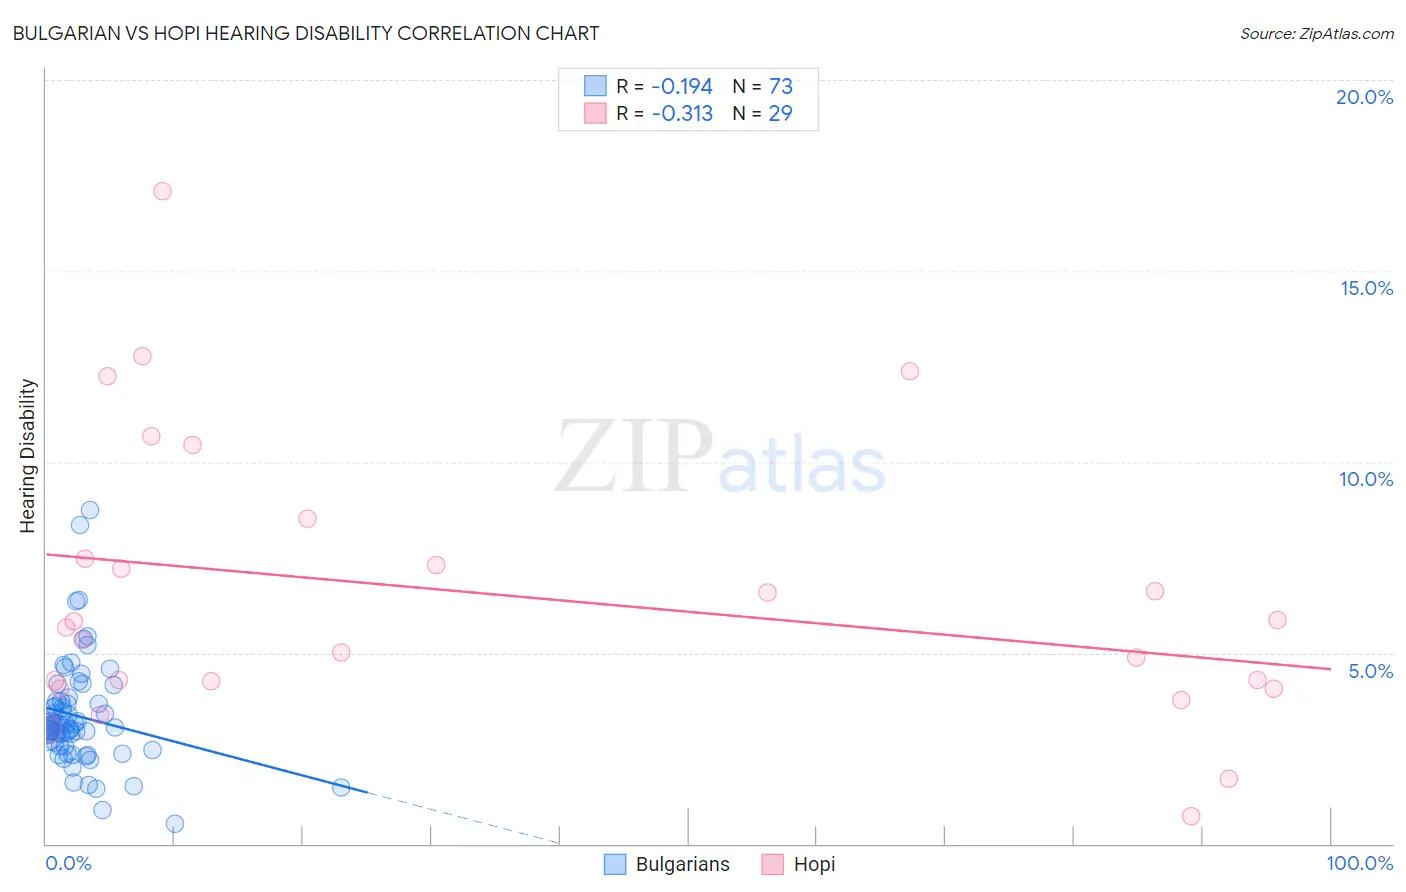
Bulgarian vs Hopi Hearing Disability Correlation Chart
The statistical analysis conducted on geographies consisting of 205,610,417 people shows a poor negative correlation between the proportion of Bulgarians and percentage of population with hearing disability in the United States with a correlation coefficient (R) of -0.194 and weighted average of 3.0%. Similarly, the statistical analysis conducted on geographies consisting of 74,726,897 people shows a mild negative correlation between the proportion of Hopi and percentage of population with hearing disability in the United States with a correlation coefficient (R) of -0.313 and weighted average of 3.9%, a difference of 30.3%.
Hearing Disability Correlation Summary
| Measurement | Bulgarian | Hopi |
| Minimum | 0.54% | 0.73% |
| Maximum | 8.7% | 17.1% |
| Range | 8.2% | 16.3% |
| Mean | 3.3% | 6.5% |
| Median | 3.1% | 5.7% |
| Interquartile 25% (IQ1) | 2.5% | 4.2% |
| Interquartile 75% (IQ3) | 3.7% | 8.0% |
| Interquartile Range (IQR) | 1.2% | 3.8% |
| Standard Deviation (Sample) | 1.4% | 3.7% |
| Standard Deviation (Population) | 1.4% | 3.6% |
Similar Demographics by Hearing Disability
Demographics Similar to Bulgarians by Hearing Disability
In terms of hearing disability, the demographic groups most similar to Bulgarians are Immigrants from Italy (3.0%, a difference of 0.14%), Immigrants from Belgium (3.0%, a difference of 0.17%), Immigrants from Ireland (3.0%, a difference of 0.23%), Immigrants from Sweden (3.0%, a difference of 0.26%), and Immigrants from Moldova (3.0%, a difference of 0.32%).
| Demographics | Rating | Rank | Hearing Disability |
| Panamanians | 47.0 /100 | #176 | Average 3.0% |
| Immigrants | Philippines | 46.4 /100 | #177 | Average 3.0% |
| Japanese | 46.0 /100 | #178 | Average 3.0% |
| Immigrants | Moldova | 43.1 /100 | #179 | Average 3.0% |
| Immigrants | Sweden | 42.4 /100 | #180 | Average 3.0% |
| Immigrants | Belgium | 41.5 /100 | #181 | Average 3.0% |
| Immigrants | Italy | 41.1 /100 | #182 | Average 3.0% |
| Bulgarians | 39.7 /100 | #183 | Fair 3.0% |
| Immigrants | Ireland | 37.4 /100 | #184 | Fair 3.0% |
| Immigrants | Southern Europe | 35.3 /100 | #185 | Fair 3.0% |
| Immigrants | Mexico | 34.9 /100 | #186 | Fair 3.0% |
| Blacks/African Americans | 34.7 /100 | #187 | Fair 3.0% |
| Mexican American Indians | 34.7 /100 | #188 | Fair 3.0% |
| Africans | 32.9 /100 | #189 | Fair 3.0% |
| Immigrants | South Africa | 31.1 /100 | #190 | Fair 3.1% |
Demographics Similar to Hopi by Hearing Disability
In terms of hearing disability, the demographic groups most similar to Hopi are Cajun (3.9%, a difference of 0.11%), Yakama (3.9%, a difference of 0.17%), Puget Sound Salish (3.9%, a difference of 0.18%), Spanish American (4.0%, a difference of 0.38%), and Comanche (4.0%, a difference of 0.51%).
| Demographics | Rating | Rank | Hearing Disability |
| Marshallese | 0.0 /100 | #306 | Tragic 3.8% |
| French Canadians | 0.0 /100 | #307 | Tragic 3.8% |
| Ottawa | 0.0 /100 | #308 | Tragic 3.8% |
| Scotch-Irish | 0.0 /100 | #309 | Tragic 3.8% |
| Cree | 0.0 /100 | #310 | Tragic 3.8% |
| Americans | 0.0 /100 | #311 | Tragic 3.9% |
| Cajuns | 0.0 /100 | #312 | Tragic 3.9% |
| Hopi | 0.0 /100 | #313 | Tragic 3.9% |
| Yakama | 0.0 /100 | #314 | Tragic 3.9% |
| Puget Sound Salish | 0.0 /100 | #315 | Tragic 3.9% |
| Spanish Americans | 0.0 /100 | #316 | Tragic 4.0% |
| Comanche | 0.0 /100 | #317 | Tragic 4.0% |
| Cheyenne | 0.0 /100 | #318 | Tragic 4.0% |
| Chippewa | 0.0 /100 | #319 | Tragic 4.0% |
| Shoshone | 0.0 /100 | #320 | Tragic 4.0% |