Bulgarian vs Immigrants from Laos Cognitive Disability
COMPARE
Bulgarian
Immigrants from Laos
Cognitive Disability
Cognitive Disability Comparison
Bulgarians
Immigrants from Laos
16.3%
COGNITIVE DISABILITY
100.0/ 100
METRIC RATING
20th/ 347
METRIC RANK
18.1%
COGNITIVE DISABILITY
0.2/ 100
METRIC RATING
275th/ 347
METRIC RANK
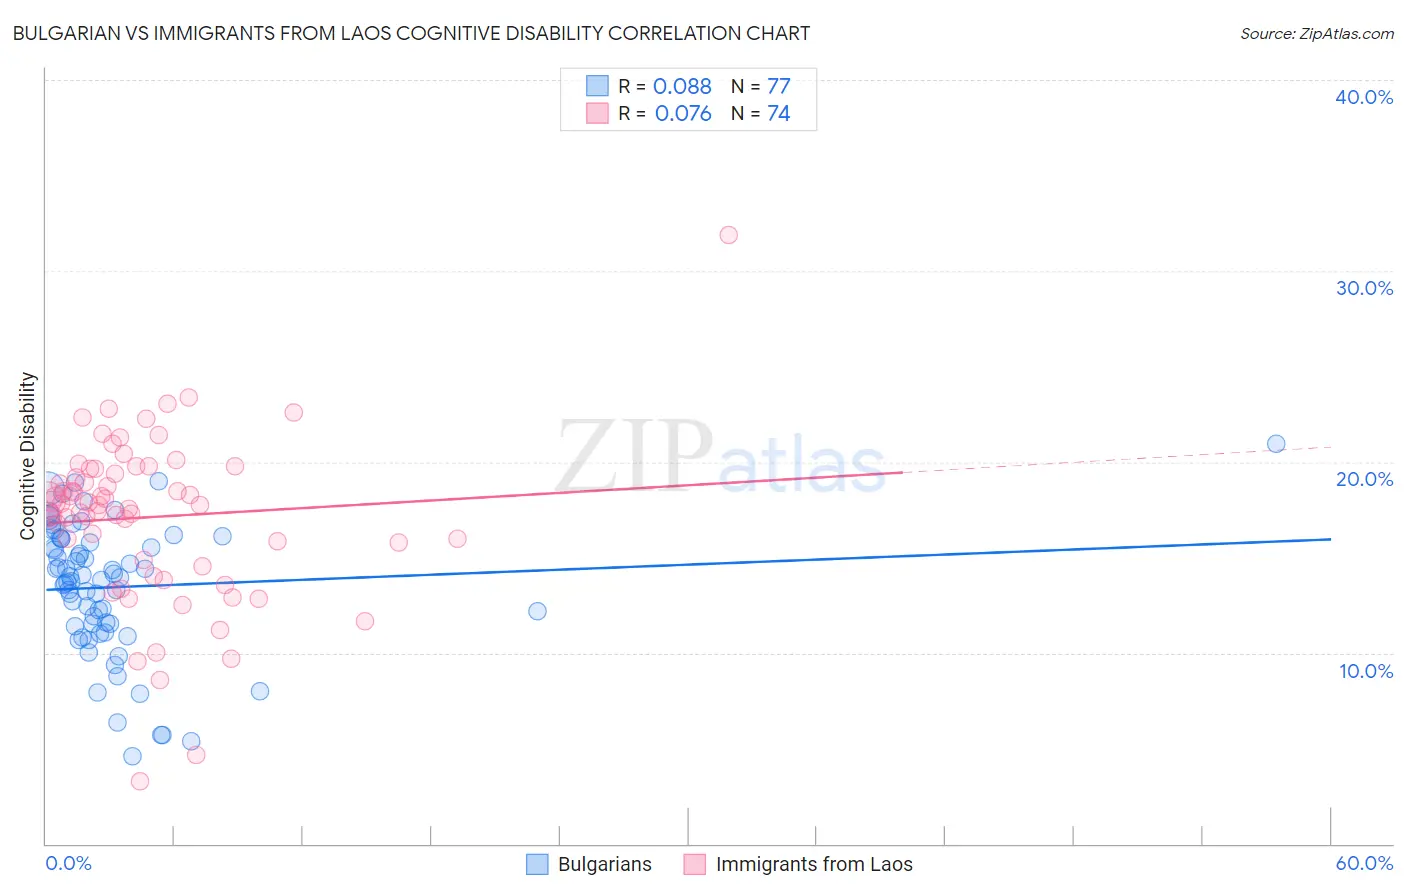
Bulgarian vs Immigrants from Laos Cognitive Disability Correlation Chart
The statistical analysis conducted on geographies consisting of 205,630,797 people shows a slight positive correlation between the proportion of Bulgarians and percentage of population with cognitive disability in the United States with a correlation coefficient (R) of 0.088 and weighted average of 16.3%. Similarly, the statistical analysis conducted on geographies consisting of 201,469,201 people shows a slight positive correlation between the proportion of Immigrants from Laos and percentage of population with cognitive disability in the United States with a correlation coefficient (R) of 0.076 and weighted average of 18.1%, a difference of 10.6%.
Cognitive Disability Correlation Summary
| Measurement | Bulgarian | Immigrants from Laos |
| Minimum | 4.6% | 3.3% |
| Maximum | 20.9% | 31.9% |
| Range | 16.4% | 28.6% |
| Mean | 13.4% | 17.1% |
| Median | 14.0% | 17.8% |
| Interquartile 25% (IQ1) | 11.4% | 14.9% |
| Interquartile 75% (IQ3) | 16.0% | 19.6% |
| Interquartile Range (IQR) | 4.6% | 4.7% |
| Standard Deviation (Sample) | 3.4% | 4.3% |
| Standard Deviation (Population) | 3.4% | 4.3% |
Similar Demographics by Cognitive Disability
Demographics Similar to Bulgarians by Cognitive Disability
In terms of cognitive disability, the demographic groups most similar to Bulgarians are Immigrants from Bolivia (16.3%, a difference of 0.010%), Immigrants from Northern Europe (16.3%, a difference of 0.020%), Immigrants from Cuba (16.3%, a difference of 0.040%), Immigrants from North Macedonia (16.3%, a difference of 0.080%), and Eastern European (16.3%, a difference of 0.10%).
| Demographics | Rating | Rank | Cognitive Disability |
| Lithuanians | 100.0 /100 | #13 | Exceptional 16.3% |
| Immigrants | Austria | 100.0 /100 | #14 | Exceptional 16.3% |
| Immigrants | Greece | 100.0 /100 | #15 | Exceptional 16.3% |
| Eastern Europeans | 100.0 /100 | #16 | Exceptional 16.3% |
| Immigrants | North Macedonia | 100.0 /100 | #17 | Exceptional 16.3% |
| Immigrants | Northern Europe | 100.0 /100 | #18 | Exceptional 16.3% |
| Immigrants | Bolivia | 100.0 /100 | #19 | Exceptional 16.3% |
| Bulgarians | 100.0 /100 | #20 | Exceptional 16.3% |
| Immigrants | Cuba | 100.0 /100 | #21 | Exceptional 16.3% |
| Immigrants | South Central Asia | 99.9 /100 | #22 | Exceptional 16.4% |
| Croatians | 99.9 /100 | #23 | Exceptional 16.4% |
| Immigrants | Argentina | 99.9 /100 | #24 | Exceptional 16.4% |
| Luxembourgers | 99.9 /100 | #25 | Exceptional 16.4% |
| Immigrants | Croatia | 99.9 /100 | #26 | Exceptional 16.4% |
| Immigrants | Pakistan | 99.9 /100 | #27 | Exceptional 16.4% |
Demographics Similar to Immigrants from Laos by Cognitive Disability
In terms of cognitive disability, the demographic groups most similar to Immigrants from Laos are Yuman (18.1%, a difference of 0.040%), Immigrants from Kuwait (18.1%, a difference of 0.050%), Immigrants from Micronesia (18.1%, a difference of 0.050%), Immigrants from Nigeria (18.0%, a difference of 0.10%), and Chippewa (18.1%, a difference of 0.10%).
| Demographics | Rating | Rank | Cognitive Disability |
| Cherokee | 0.3 /100 | #268 | Tragic 18.0% |
| Hondurans | 0.3 /100 | #269 | Tragic 18.0% |
| Immigrants | Bahamas | 0.3 /100 | #270 | Tragic 18.0% |
| Potawatomi | 0.2 /100 | #271 | Tragic 18.0% |
| Immigrants | Honduras | 0.2 /100 | #272 | Tragic 18.0% |
| Immigrants | Nepal | 0.2 /100 | #273 | Tragic 18.0% |
| Immigrants | Nigeria | 0.2 /100 | #274 | Tragic 18.0% |
| Immigrants | Laos | 0.2 /100 | #275 | Tragic 18.1% |
| Yuman | 0.2 /100 | #276 | Tragic 18.1% |
| Immigrants | Kuwait | 0.2 /100 | #277 | Tragic 18.1% |
| Immigrants | Micronesia | 0.2 /100 | #278 | Tragic 18.1% |
| Chippewa | 0.1 /100 | #279 | Tragic 18.1% |
| West Indians | 0.1 /100 | #280 | Tragic 18.1% |
| Yakama | 0.1 /100 | #281 | Tragic 18.1% |
| Immigrants | Cambodia | 0.1 /100 | #282 | Tragic 18.1% |