Bulgarian vs Immigrants from England Disability Age Under 5
COMPARE
Bulgarian
Immigrants from England
Disability Age Under 5
Disability Age Under 5 Comparison
Bulgarians
Immigrants from England
1.3%
DISABILITY AGE UNDER 5
19.5/ 100
METRIC RATING
209th/ 347
METRIC RANK
1.4%
DISABILITY AGE UNDER 5
1.0/ 100
METRIC RATING
247th/ 347
METRIC RANK
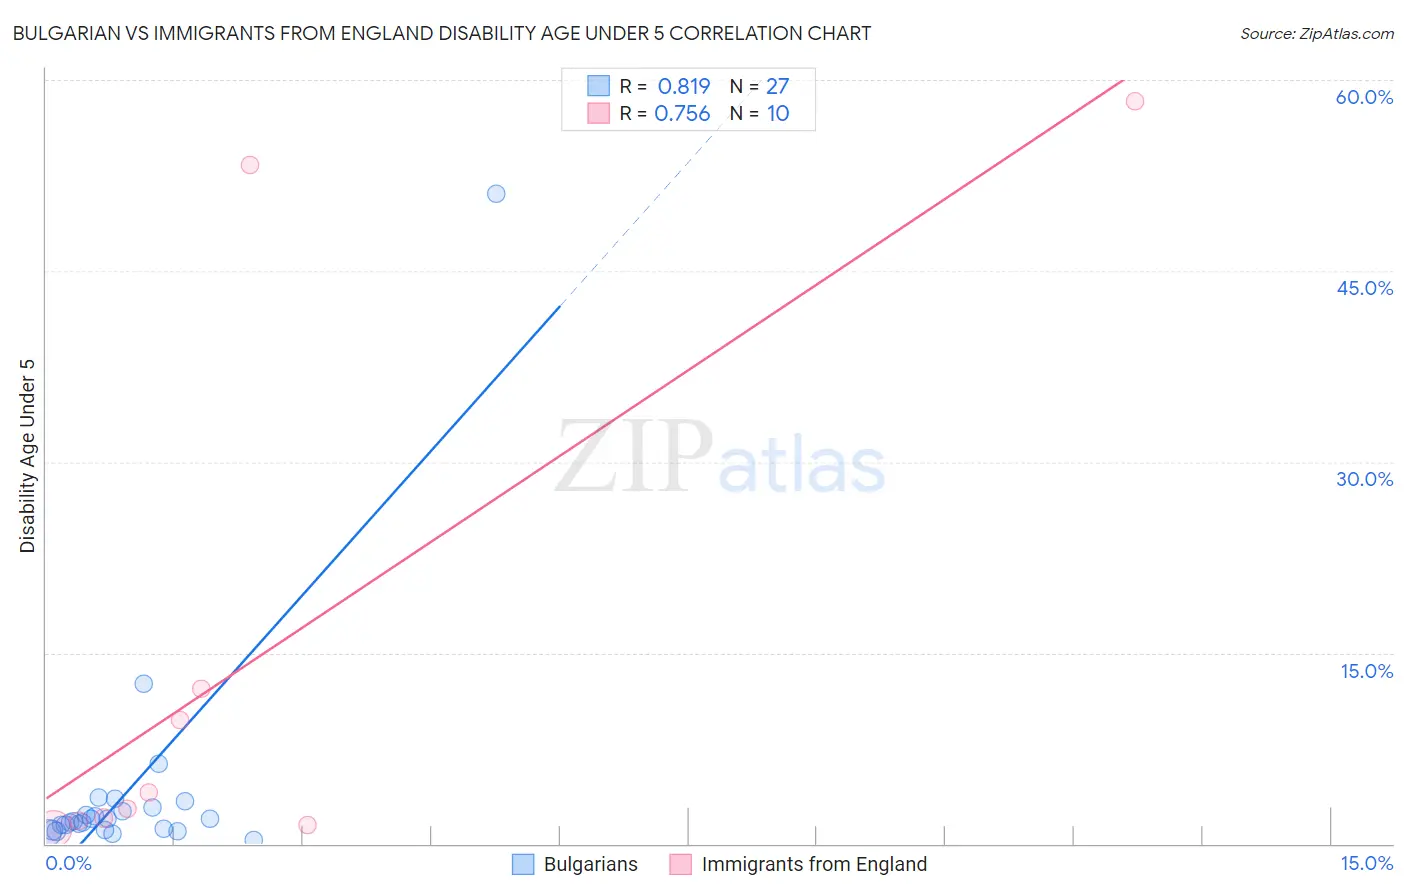
Bulgarian vs Immigrants from England Disability Age Under 5 Correlation Chart
The statistical analysis conducted on geographies consisting of 131,414,932 people shows a very strong positive correlation between the proportion of Bulgarians and percentage of population with a disability under the age of 5 in the United States with a correlation coefficient (R) of 0.819 and weighted average of 1.3%. Similarly, the statistical analysis conducted on geographies consisting of 209,371,779 people shows a strong positive correlation between the proportion of Immigrants from England and percentage of population with a disability under the age of 5 in the United States with a correlation coefficient (R) of 0.756 and weighted average of 1.4%, a difference of 6.9%.
Disability Age Under 5 Correlation Summary
| Measurement | Bulgarian | Immigrants from England |
| Minimum | 0.31% | 1.2% |
| Maximum | 51.1% | 58.3% |
| Range | 50.8% | 57.2% |
| Mean | 4.2% | 14.7% |
| Median | 1.7% | 3.4% |
| Interquartile 25% (IQ1) | 1.1% | 1.8% |
| Interquartile 75% (IQ3) | 2.8% | 12.1% |
| Interquartile Range (IQR) | 1.7% | 10.3% |
| Standard Deviation (Sample) | 9.7% | 22.0% |
| Standard Deviation (Population) | 9.5% | 20.9% |
Similar Demographics by Disability Age Under 5
Demographics Similar to Bulgarians by Disability Age Under 5
In terms of disability age under 5, the demographic groups most similar to Bulgarians are Pakistani (1.3%, a difference of 0.010%), Immigrants from Greece (1.3%, a difference of 0.050%), Chilean (1.3%, a difference of 0.090%), Immigrants from Sudan (1.3%, a difference of 0.11%), and Mexican (1.3%, a difference of 0.18%).
| Demographics | Rating | Rank | Disability Age Under 5 |
| Arapaho | 24.1 /100 | #202 | Fair 1.3% |
| Liberians | 24.0 /100 | #203 | Fair 1.3% |
| Immigrants | Europe | 23.6 /100 | #204 | Fair 1.3% |
| Romanians | 22.5 /100 | #205 | Fair 1.3% |
| Immigrants | Poland | 22.4 /100 | #206 | Fair 1.3% |
| Nigerians | 21.2 /100 | #207 | Fair 1.3% |
| Mexicans | 20.8 /100 | #208 | Fair 1.3% |
| Bulgarians | 19.5 /100 | #209 | Poor 1.3% |
| Pakistanis | 19.4 /100 | #210 | Poor 1.3% |
| Immigrants | Greece | 19.1 /100 | #211 | Poor 1.3% |
| Chileans | 18.8 /100 | #212 | Poor 1.3% |
| Immigrants | Sudan | 18.7 /100 | #213 | Poor 1.3% |
| Immigrants | Chile | 17.2 /100 | #214 | Poor 1.3% |
| Syrians | 16.1 /100 | #215 | Poor 1.3% |
| Bangladeshis | 15.5 /100 | #216 | Poor 1.3% |
Demographics Similar to Immigrants from England by Disability Age Under 5
In terms of disability age under 5, the demographic groups most similar to Immigrants from England are Russian (1.4%, a difference of 0.010%), Eastern European (1.4%, a difference of 0.030%), Bermudan (1.4%, a difference of 0.11%), African (1.4%, a difference of 0.12%), and Potawatomi (1.4%, a difference of 0.14%).
| Demographics | Rating | Rank | Disability Age Under 5 |
| Native Hawaiians | 2.2 /100 | #240 | Tragic 1.3% |
| Maltese | 2.2 /100 | #241 | Tragic 1.3% |
| Lumbee | 2.1 /100 | #242 | Tragic 1.3% |
| Immigrants | Cameroon | 1.7 /100 | #243 | Tragic 1.4% |
| Spaniards | 1.4 /100 | #244 | Tragic 1.4% |
| Potawatomi | 1.1 /100 | #245 | Tragic 1.4% |
| Russians | 1.0 /100 | #246 | Tragic 1.4% |
| Immigrants | England | 1.0 /100 | #247 | Tragic 1.4% |
| Eastern Europeans | 1.0 /100 | #248 | Tragic 1.4% |
| Bermudans | 1.0 /100 | #249 | Tragic 1.4% |
| Africans | 1.0 /100 | #250 | Tragic 1.4% |
| Immigrants | Hungary | 1.0 /100 | #251 | Tragic 1.4% |
| Immigrants | Scotland | 0.9 /100 | #252 | Tragic 1.4% |
| Australians | 0.7 /100 | #253 | Tragic 1.4% |
| Immigrants | Brazil | 0.7 /100 | #254 | Tragic 1.4% |