Immigrants from Kuwait vs Immigrants from Zimbabwe Disability
COMPARE
Immigrants from Kuwait
Immigrants from Zimbabwe
Disability
Disability Comparison
Immigrants from Kuwait
Immigrants from Zimbabwe
10.7%
DISABILITY
100.0/ 100
METRIC RATING
33rd/ 347
METRIC RANK
11.2%
DISABILITY
97.7/ 100
METRIC RATING
96th/ 347
METRIC RANK
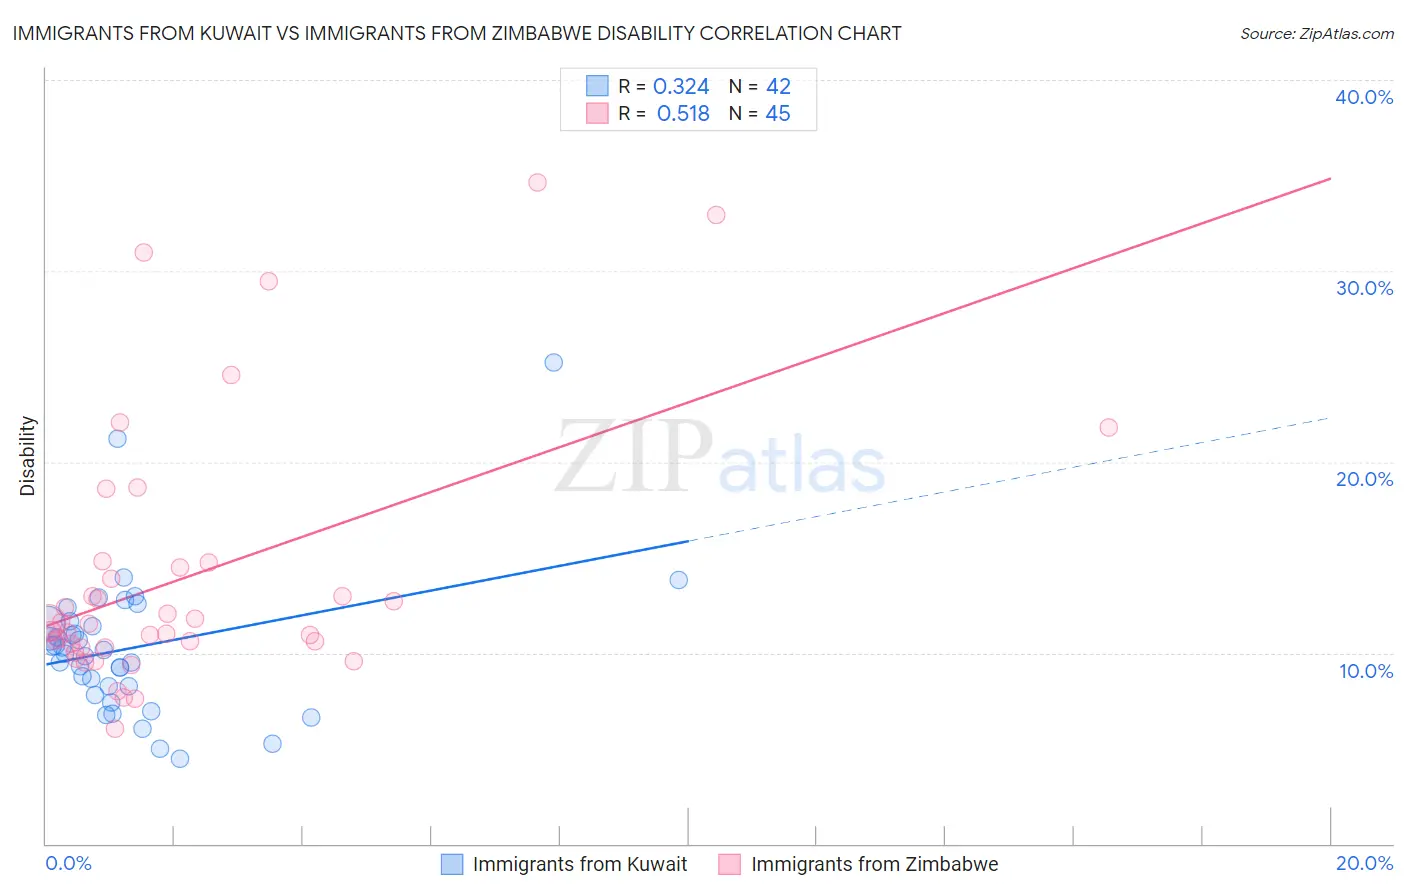
Immigrants from Kuwait vs Immigrants from Zimbabwe Disability Correlation Chart
The statistical analysis conducted on geographies consisting of 136,916,630 people shows a mild positive correlation between the proportion of Immigrants from Kuwait and percentage of population with a disability in the United States with a correlation coefficient (R) of 0.324 and weighted average of 10.7%. Similarly, the statistical analysis conducted on geographies consisting of 117,811,859 people shows a substantial positive correlation between the proportion of Immigrants from Zimbabwe and percentage of population with a disability in the United States with a correlation coefficient (R) of 0.518 and weighted average of 11.2%, a difference of 5.1%.
Disability Correlation Summary
| Measurement | Immigrants from Kuwait | Immigrants from Zimbabwe |
| Minimum | 4.4% | 6.0% |
| Maximum | 25.2% | 34.6% |
| Range | 20.8% | 28.6% |
| Mean | 10.3% | 14.0% |
| Median | 10.0% | 11.5% |
| Interquartile 25% (IQ1) | 8.3% | 10.3% |
| Interquartile 75% (IQ3) | 11.5% | 14.6% |
| Interquartile Range (IQR) | 3.2% | 4.3% |
| Standard Deviation (Sample) | 3.8% | 6.8% |
| Standard Deviation (Population) | 3.8% | 6.8% |
Similar Demographics by Disability
Demographics Similar to Immigrants from Kuwait by Disability
In terms of disability, the demographic groups most similar to Immigrants from Kuwait are Immigrants from Ethiopia (10.7%, a difference of 0.22%), Immigrants from Indonesia (10.7%, a difference of 0.23%), Paraguayan (10.6%, a difference of 0.25%), Ethiopian (10.7%, a difference of 0.29%), and Turkish (10.7%, a difference of 0.30%).
| Demographics | Rating | Rank | Disability |
| Argentineans | 100.0 /100 | #26 | Exceptional 10.6% |
| Cypriots | 100.0 /100 | #27 | Exceptional 10.6% |
| Egyptians | 100.0 /100 | #28 | Exceptional 10.6% |
| Immigrants | Argentina | 100.0 /100 | #29 | Exceptional 10.6% |
| Immigrants | Turkey | 100.0 /100 | #30 | Exceptional 10.6% |
| Immigrants | Egypt | 100.0 /100 | #31 | Exceptional 10.6% |
| Paraguayans | 100.0 /100 | #32 | Exceptional 10.6% |
| Immigrants | Kuwait | 100.0 /100 | #33 | Exceptional 10.7% |
| Immigrants | Ethiopia | 100.0 /100 | #34 | Exceptional 10.7% |
| Immigrants | Indonesia | 100.0 /100 | #35 | Exceptional 10.7% |
| Ethiopians | 100.0 /100 | #36 | Exceptional 10.7% |
| Turks | 100.0 /100 | #37 | Exceptional 10.7% |
| Afghans | 99.9 /100 | #38 | Exceptional 10.8% |
| Cambodians | 99.9 /100 | #39 | Exceptional 10.8% |
| Mongolians | 99.9 /100 | #40 | Exceptional 10.8% |
Demographics Similar to Immigrants from Zimbabwe by Disability
In terms of disability, the demographic groups most similar to Immigrants from Zimbabwe are Eastern European (11.2%, a difference of 0.060%), Immigrants from Morocco (11.2%, a difference of 0.070%), Bhutanese (11.2%, a difference of 0.14%), Uruguayan (11.2%, a difference of 0.14%), and Immigrants from Czechoslovakia (11.2%, a difference of 0.15%).
| Demographics | Rating | Rank | Disability |
| Immigrants | South Africa | 98.2 /100 | #89 | Exceptional 11.2% |
| Immigrants | Brazil | 98.1 /100 | #90 | Exceptional 11.2% |
| Immigrants | Western Asia | 98.1 /100 | #91 | Exceptional 11.2% |
| Ecuadorians | 98.0 /100 | #92 | Exceptional 11.2% |
| Immigrants | Ecuador | 98.0 /100 | #93 | Exceptional 11.2% |
| Immigrants | Morocco | 97.8 /100 | #94 | Exceptional 11.2% |
| Eastern Europeans | 97.8 /100 | #95 | Exceptional 11.2% |
| Immigrants | Zimbabwe | 97.7 /100 | #96 | Exceptional 11.2% |
| Bhutanese | 97.4 /100 | #97 | Exceptional 11.2% |
| Uruguayans | 97.4 /100 | #98 | Exceptional 11.2% |
| Immigrants | Czechoslovakia | 97.4 /100 | #99 | Exceptional 11.2% |
| Immigrants | Greece | 96.9 /100 | #100 | Exceptional 11.3% |
| Immigrants | Nicaragua | 96.8 /100 | #101 | Exceptional 11.3% |
| Immigrants | Eastern Africa | 96.7 /100 | #102 | Exceptional 11.3% |
| Immigrants | Uruguay | 96.4 /100 | #103 | Exceptional 11.3% |