Black/African American vs Aleut Disability Age 18 to 34
COMPARE
Black/African American
Aleut
Disability Age 18 to 34
Disability Age 18 to 34 Comparison
Blacks/African Americans
Aleuts
7.7%
DISABILITY AGE 18 TO 34
0.0/ 100
METRIC RATING
292nd/ 347
METRIC RANK
8.1%
DISABILITY AGE 18 TO 34
0.0/ 100
METRIC RATING
319th/ 347
METRIC RANK
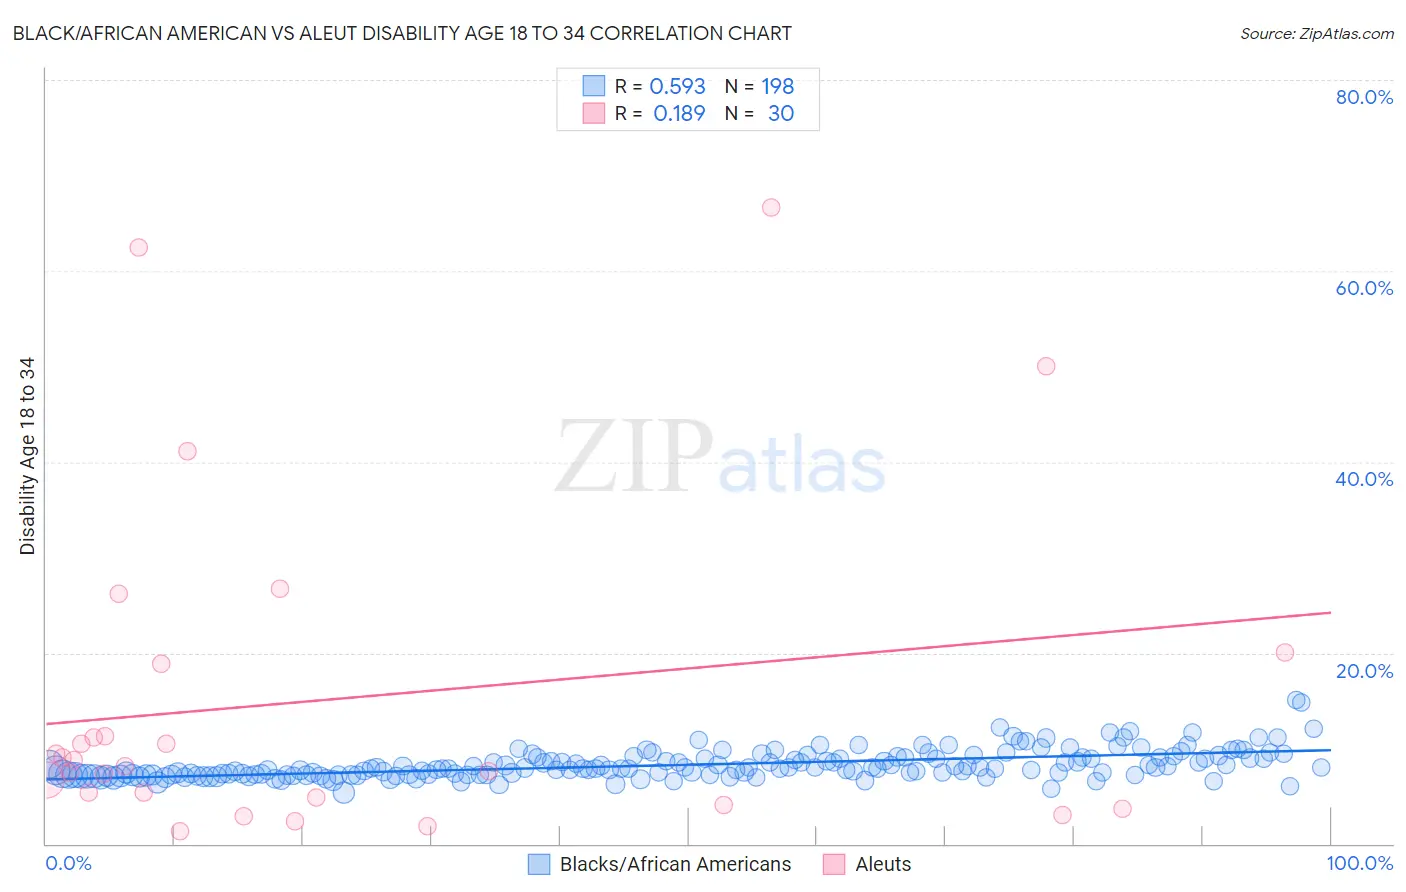
Black/African American vs Aleut Disability Age 18 to 34 Correlation Chart
The statistical analysis conducted on geographies consisting of 561,495,678 people shows a substantial positive correlation between the proportion of Blacks/African Americans and percentage of population with a disability between the ages 18 and 35 in the United States with a correlation coefficient (R) of 0.593 and weighted average of 7.7%. Similarly, the statistical analysis conducted on geographies consisting of 61,734,200 people shows a poor positive correlation between the proportion of Aleuts and percentage of population with a disability between the ages 18 and 35 in the United States with a correlation coefficient (R) of 0.189 and weighted average of 8.1%, a difference of 5.4%.
Disability Age 18 to 34 Correlation Summary
| Measurement | Black/African American | Aleut |
| Minimum | 5.3% | 1.4% |
| Maximum | 15.1% | 66.7% |
| Range | 9.7% | 65.3% |
| Mean | 8.3% | 15.2% |
| Median | 7.9% | 8.5% |
| Interquartile 25% (IQ1) | 7.2% | 4.9% |
| Interquartile 75% (IQ3) | 9.0% | 18.9% |
| Interquartile Range (IQR) | 1.8% | 14.1% |
| Standard Deviation (Sample) | 1.5% | 17.6% |
| Standard Deviation (Population) | 1.5% | 17.3% |
Similar Demographics by Disability Age 18 to 34
Demographics Similar to Blacks/African Americans by Disability Age 18 to 34
In terms of disability age 18 to 34, the demographic groups most similar to Blacks/African Americans are Scandinavian (7.7%, a difference of 0.060%), Immigrants from Cabo Verde (7.7%, a difference of 0.21%), Irish (7.7%, a difference of 0.22%), Tlingit-Haida (7.7%, a difference of 0.22%), and Slovak (7.7%, a difference of 0.27%).
| Demographics | Rating | Rank | Disability Age 18 to 34 |
| Swedes | 0.0 /100 | #285 | Tragic 7.5% |
| Celtics | 0.0 /100 | #286 | Tragic 7.6% |
| Norwegians | 0.0 /100 | #287 | Tragic 7.6% |
| Whites/Caucasians | 0.0 /100 | #288 | Tragic 7.6% |
| Immigrants | Nonimmigrants | 0.0 /100 | #289 | Tragic 7.6% |
| Slovaks | 0.0 /100 | #290 | Tragic 7.7% |
| Irish | 0.0 /100 | #291 | Tragic 7.7% |
| Blacks/African Americans | 0.0 /100 | #292 | Tragic 7.7% |
| Scandinavians | 0.0 /100 | #293 | Tragic 7.7% |
| Immigrants | Cabo Verde | 0.0 /100 | #294 | Tragic 7.7% |
| Tlingit-Haida | 0.0 /100 | #295 | Tragic 7.7% |
| Cape Verdeans | 0.0 /100 | #296 | Tragic 7.7% |
| Pueblo | 0.0 /100 | #297 | Tragic 7.7% |
| Dutch | 0.0 /100 | #298 | Tragic 7.7% |
| Germans | 0.0 /100 | #299 | Tragic 7.7% |
Demographics Similar to Aleuts by Disability Age 18 to 34
In terms of disability age 18 to 34, the demographic groups most similar to Aleuts are French Canadian (8.1%, a difference of 0.040%), Navajo (8.1%, a difference of 0.050%), Blackfeet (8.1%, a difference of 0.41%), Cree (8.1%, a difference of 0.46%), and Hmong (8.1%, a difference of 0.47%).
| Demographics | Rating | Rank | Disability Age 18 to 34 |
| Spanish Americans | 0.0 /100 | #312 | Tragic 7.9% |
| Iroquois | 0.0 /100 | #313 | Tragic 7.9% |
| Colville | 0.0 /100 | #314 | Tragic 7.9% |
| Americans | 0.0 /100 | #315 | Tragic 8.0% |
| Puerto Ricans | 0.0 /100 | #316 | Tragic 8.0% |
| Hmong | 0.0 /100 | #317 | Tragic 8.1% |
| French Canadians | 0.0 /100 | #318 | Tragic 8.1% |
| Aleuts | 0.0 /100 | #319 | Tragic 8.1% |
| Navajo | 0.0 /100 | #320 | Tragic 8.1% |
| Blackfeet | 0.0 /100 | #321 | Tragic 8.1% |
| Cree | 0.0 /100 | #322 | Tragic 8.1% |
| French American Indians | 0.0 /100 | #323 | Tragic 8.2% |
| Cajuns | 0.0 /100 | #324 | Tragic 8.2% |
| Natives/Alaskans | 0.0 /100 | #325 | Tragic 8.2% |
| Potawatomi | 0.0 /100 | #326 | Tragic 8.2% |