Black/African American vs Native/Alaskan Disability Age 18 to 34
COMPARE
Black/African American
Native/Alaskan
Disability Age 18 to 34
Disability Age 18 to 34 Comparison
Blacks/African Americans
Natives/Alaskans
7.7%
DISABILITY AGE 18 TO 34
0.0/ 100
METRIC RATING
292nd/ 347
METRIC RANK
8.2%
DISABILITY AGE 18 TO 34
0.0/ 100
METRIC RATING
325th/ 347
METRIC RANK
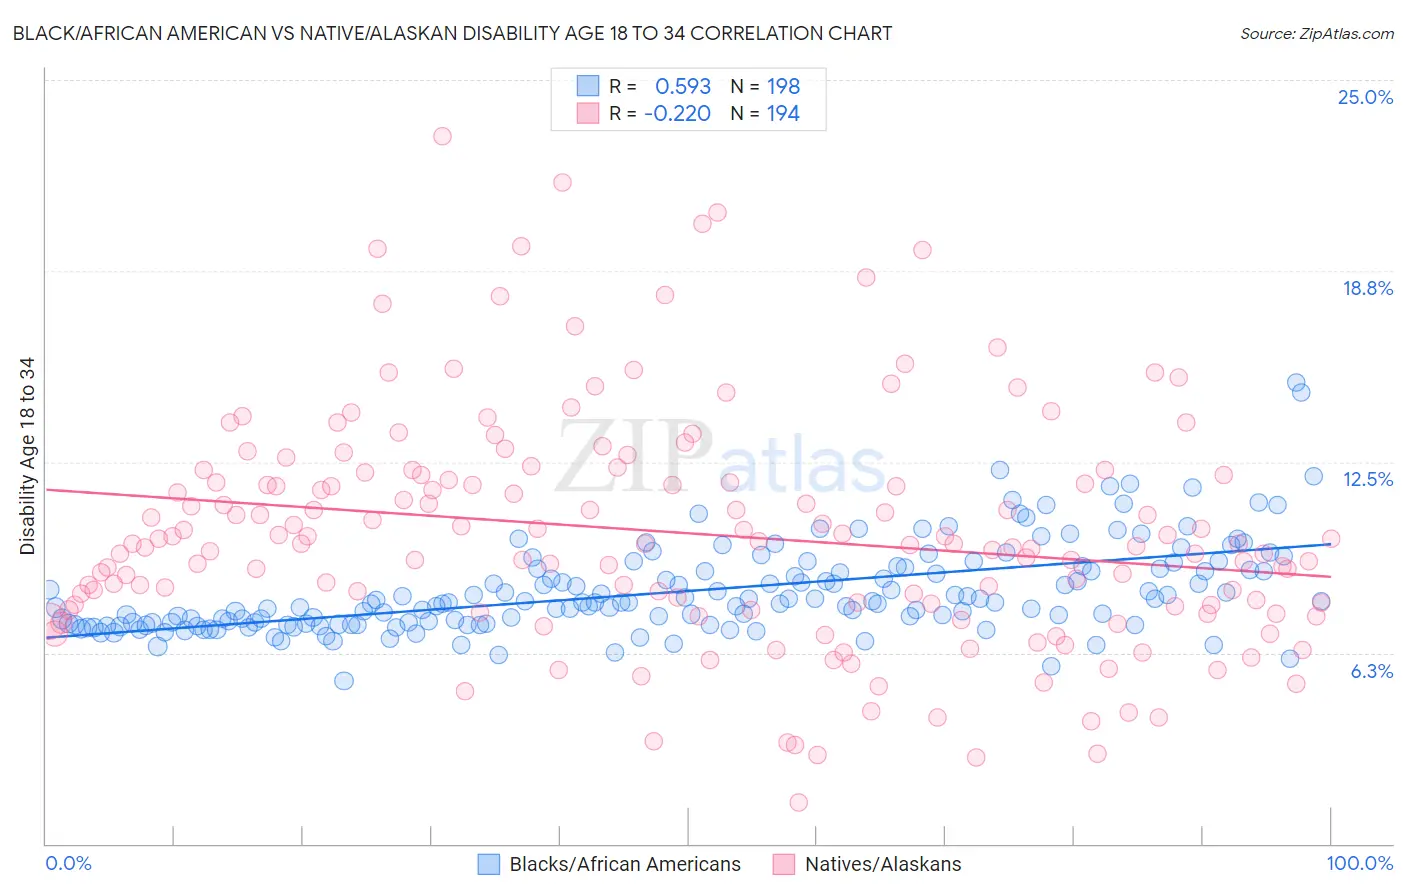
Black/African American vs Native/Alaskan Disability Age 18 to 34 Correlation Chart
The statistical analysis conducted on geographies consisting of 561,495,678 people shows a substantial positive correlation between the proportion of Blacks/African Americans and percentage of population with a disability between the ages 18 and 35 in the United States with a correlation coefficient (R) of 0.593 and weighted average of 7.7%. Similarly, the statistical analysis conducted on geographies consisting of 510,415,530 people shows a weak negative correlation between the proportion of Natives/Alaskans and percentage of population with a disability between the ages 18 and 35 in the United States with a correlation coefficient (R) of -0.220 and weighted average of 8.2%, a difference of 7.0%.
Disability Age 18 to 34 Correlation Summary
| Measurement | Black/African American | Native/Alaskan |
| Minimum | 5.3% | 1.4% |
| Maximum | 15.1% | 23.1% |
| Range | 9.7% | 21.8% |
| Mean | 8.3% | 10.2% |
| Median | 7.9% | 9.8% |
| Interquartile 25% (IQ1) | 7.2% | 7.8% |
| Interquartile 75% (IQ3) | 9.0% | 12.1% |
| Interquartile Range (IQR) | 1.8% | 4.2% |
| Standard Deviation (Sample) | 1.5% | 3.8% |
| Standard Deviation (Population) | 1.5% | 3.8% |
Similar Demographics by Disability Age 18 to 34
Demographics Similar to Blacks/African Americans by Disability Age 18 to 34
In terms of disability age 18 to 34, the demographic groups most similar to Blacks/African Americans are Scandinavian (7.7%, a difference of 0.060%), Immigrants from Cabo Verde (7.7%, a difference of 0.21%), Irish (7.7%, a difference of 0.22%), Tlingit-Haida (7.7%, a difference of 0.22%), and Slovak (7.7%, a difference of 0.27%).
| Demographics | Rating | Rank | Disability Age 18 to 34 |
| Swedes | 0.0 /100 | #285 | Tragic 7.5% |
| Celtics | 0.0 /100 | #286 | Tragic 7.6% |
| Norwegians | 0.0 /100 | #287 | Tragic 7.6% |
| Whites/Caucasians | 0.0 /100 | #288 | Tragic 7.6% |
| Immigrants | Nonimmigrants | 0.0 /100 | #289 | Tragic 7.6% |
| Slovaks | 0.0 /100 | #290 | Tragic 7.7% |
| Irish | 0.0 /100 | #291 | Tragic 7.7% |
| Blacks/African Americans | 0.0 /100 | #292 | Tragic 7.7% |
| Scandinavians | 0.0 /100 | #293 | Tragic 7.7% |
| Immigrants | Cabo Verde | 0.0 /100 | #294 | Tragic 7.7% |
| Tlingit-Haida | 0.0 /100 | #295 | Tragic 7.7% |
| Cape Verdeans | 0.0 /100 | #296 | Tragic 7.7% |
| Pueblo | 0.0 /100 | #297 | Tragic 7.7% |
| Dutch | 0.0 /100 | #298 | Tragic 7.7% |
| Germans | 0.0 /100 | #299 | Tragic 7.7% |
Demographics Similar to Natives/Alaskans by Disability Age 18 to 34
In terms of disability age 18 to 34, the demographic groups most similar to Natives/Alaskans are Potawatomi (8.2%, a difference of 0.020%), Sioux (8.2%, a difference of 0.14%), Delaware (8.2%, a difference of 0.19%), Cajun (8.2%, a difference of 0.52%), and French American Indian (8.2%, a difference of 0.56%).
| Demographics | Rating | Rank | Disability Age 18 to 34 |
| French Canadians | 0.0 /100 | #318 | Tragic 8.1% |
| Aleuts | 0.0 /100 | #319 | Tragic 8.1% |
| Navajo | 0.0 /100 | #320 | Tragic 8.1% |
| Blackfeet | 0.0 /100 | #321 | Tragic 8.1% |
| Cree | 0.0 /100 | #322 | Tragic 8.1% |
| French American Indians | 0.0 /100 | #323 | Tragic 8.2% |
| Cajuns | 0.0 /100 | #324 | Tragic 8.2% |
| Natives/Alaskans | 0.0 /100 | #325 | Tragic 8.2% |
| Potawatomi | 0.0 /100 | #326 | Tragic 8.2% |
| Sioux | 0.0 /100 | #327 | Tragic 8.2% |
| Delaware | 0.0 /100 | #328 | Tragic 8.2% |
| Crow | 0.0 /100 | #329 | Tragic 8.3% |
| Osage | 0.0 /100 | #330 | Tragic 8.3% |
| Comanche | 0.0 /100 | #331 | Tragic 8.3% |
| Puget Sound Salish | 0.0 /100 | #332 | Tragic 8.3% |