Bahamian vs Zimbabwean Disability Age 18 to 34
COMPARE
Bahamian
Zimbabwean
Disability Age 18 to 34
Disability Age 18 to 34 Comparison
Bahamians
Zimbabweans
6.6%
DISABILITY AGE 18 TO 34
55.5/ 100
METRIC RATING
171st/ 347
METRIC RANK
6.5%
DISABILITY AGE 18 TO 34
74.7/ 100
METRIC RATING
158th/ 347
METRIC RANK
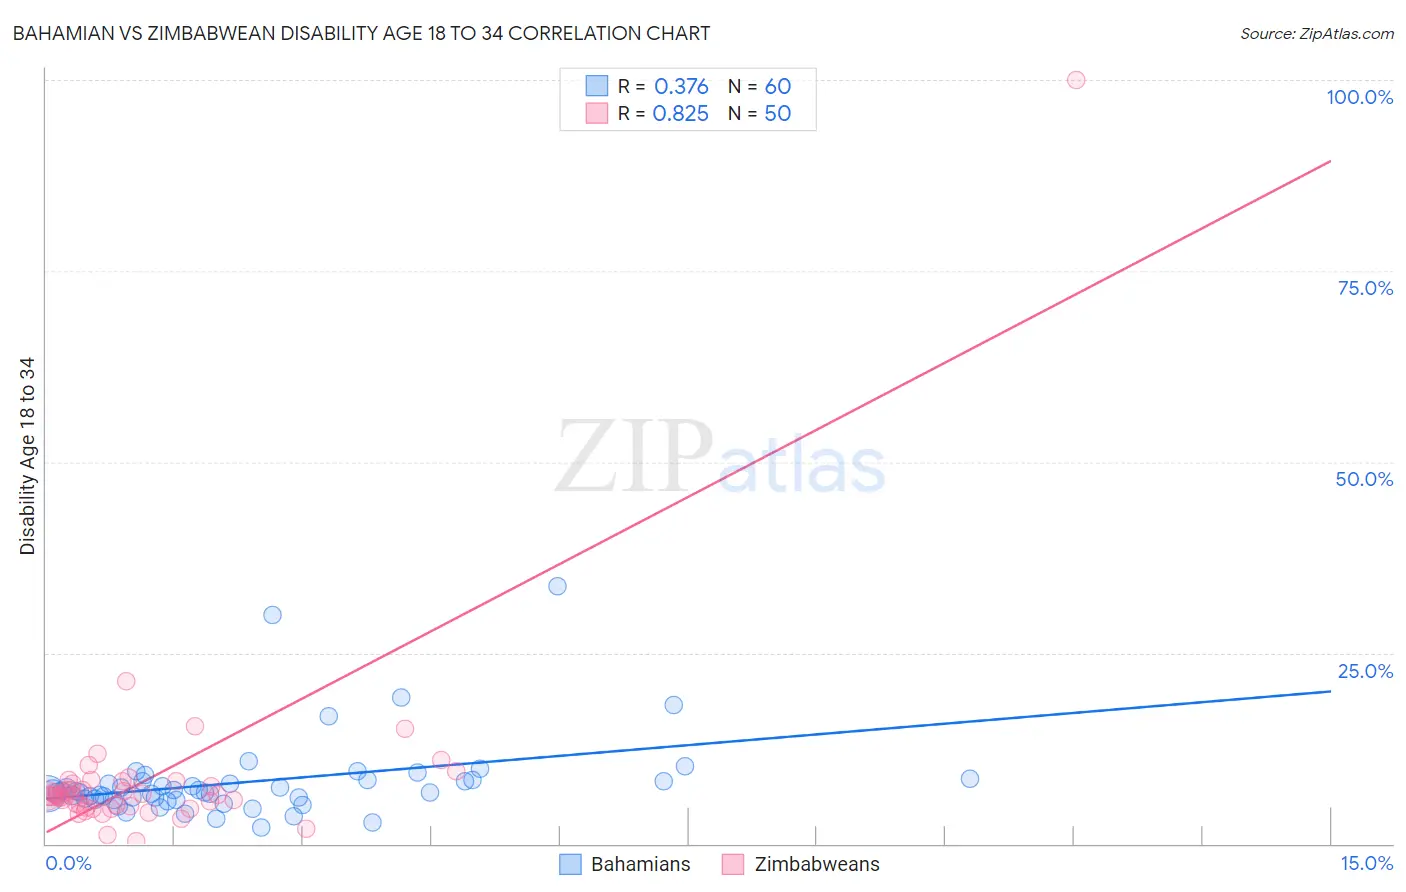
Bahamian vs Zimbabwean Disability Age 18 to 34 Correlation Chart
The statistical analysis conducted on geographies consisting of 112,638,340 people shows a mild positive correlation between the proportion of Bahamians and percentage of population with a disability between the ages 18 and 35 in the United States with a correlation coefficient (R) of 0.376 and weighted average of 6.6%. Similarly, the statistical analysis conducted on geographies consisting of 69,205,291 people shows a very strong positive correlation between the proportion of Zimbabweans and percentage of population with a disability between the ages 18 and 35 in the United States with a correlation coefficient (R) of 0.825 and weighted average of 6.5%, a difference of 1.5%.
Disability Age 18 to 34 Correlation Summary
| Measurement | Bahamian | Zimbabwean |
| Minimum | 2.1% | 0.28% |
| Maximum | 33.8% | 100.0% |
| Range | 31.7% | 99.7% |
| Mean | 8.1% | 8.7% |
| Median | 6.8% | 6.3% |
| Interquartile 25% (IQ1) | 5.9% | 5.0% |
| Interquartile 75% (IQ3) | 8.3% | 8.1% |
| Interquartile Range (IQR) | 2.4% | 3.1% |
| Standard Deviation (Sample) | 5.4% | 13.6% |
| Standard Deviation (Population) | 5.4% | 13.5% |
Demographics Similar to Bahamians and Zimbabweans by Disability Age 18 to 34
In terms of disability age 18 to 34, the demographic groups most similar to Bahamians are Ghanaian (6.6%, a difference of 0.050%), Immigrants from Mexico (6.6%, a difference of 0.10%), Immigrants from Bahamas (6.6%, a difference of 0.17%), Russian (6.5%, a difference of 0.34%), and Native Hawaiian (6.6%, a difference of 0.38%). Similarly, the demographic groups most similar to Zimbabweans are Immigrants from Sierra Leone (6.5%, a difference of 0.030%), Immigrants from Panama (6.5%, a difference of 0.060%), Dominican (6.5%, a difference of 0.11%), Inupiat (6.5%, a difference of 0.19%), and Immigrants from Central America (6.5%, a difference of 0.20%).
| Demographics | Rating | Rank | Disability Age 18 to 34 |
| Immigrants | Central America | 76.8 /100 | #154 | Good 6.5% |
| Inupiat | 76.7 /100 | #155 | Good 6.5% |
| Immigrants | Panama | 75.3 /100 | #156 | Good 6.5% |
| Immigrants | Sierra Leone | 75.0 /100 | #157 | Good 6.5% |
| Zimbabweans | 74.7 /100 | #158 | Good 6.5% |
| Dominicans | 73.6 /100 | #159 | Good 6.5% |
| Immigrants | Southern Europe | 72.5 /100 | #160 | Good 6.5% |
| Arabs | 72.3 /100 | #161 | Good 6.5% |
| South Africans | 71.7 /100 | #162 | Good 6.5% |
| Immigrants | Denmark | 71.7 /100 | #163 | Good 6.5% |
| Immigrants | Nigeria | 70.4 /100 | #164 | Good 6.5% |
| Immigrants | Hungary | 69.6 /100 | #165 | Good 6.5% |
| Eastern Europeans | 65.1 /100 | #166 | Good 6.5% |
| Immigrants | Northern Europe | 64.1 /100 | #167 | Good 6.5% |
| Immigrants | Moldova | 63.1 /100 | #168 | Good 6.5% |
| Russians | 60.2 /100 | #169 | Good 6.5% |
| Immigrants | Bahamas | 57.9 /100 | #170 | Average 6.6% |
| Bahamians | 55.5 /100 | #171 | Average 6.6% |
| Ghanaians | 54.7 /100 | #172 | Average 6.6% |
| Immigrants | Mexico | 54.1 /100 | #173 | Average 6.6% |
| Native Hawaiians | 50.0 /100 | #174 | Average 6.6% |