Iraqi vs Soviet Union Disability Age Over 75
COMPARE
Iraqi
Soviet Union
Disability Age Over 75
Disability Age Over 75 Comparison
Iraqis
Soviet Union
48.6%
DISABILITY AGE OVER 75
1.0/ 100
METRIC RATING
249th/ 347
METRIC RANK
46.2%
DISABILITY AGE OVER 75
98.8/ 100
METRIC RATING
80th/ 347
METRIC RANK
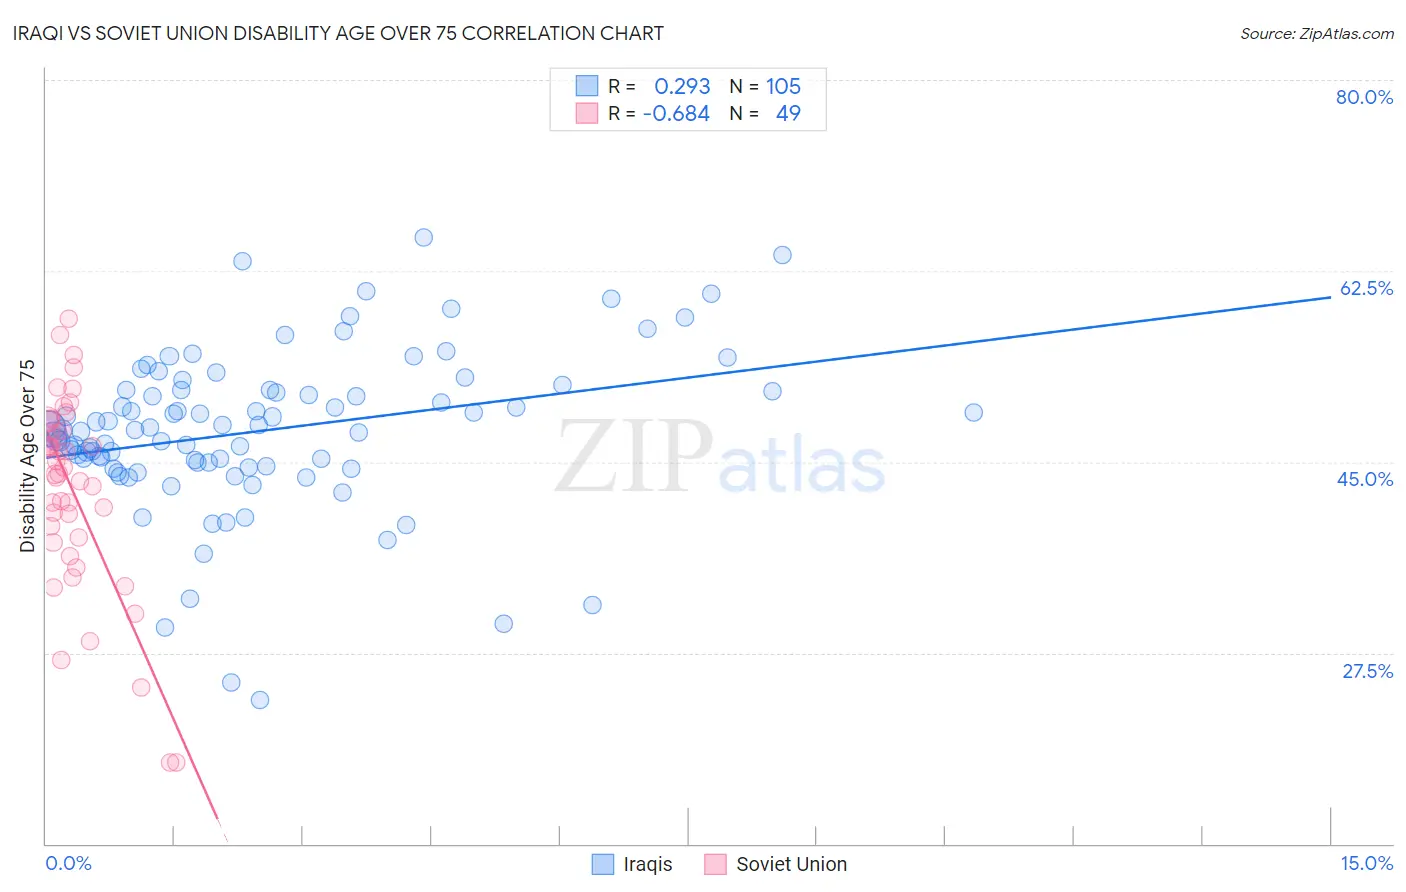
Iraqi vs Soviet Union Disability Age Over 75 Correlation Chart
The statistical analysis conducted on geographies consisting of 170,579,857 people shows a weak positive correlation between the proportion of Iraqis and percentage of population with a disability over the age of 75 in the United States with a correlation coefficient (R) of 0.293 and weighted average of 48.6%. Similarly, the statistical analysis conducted on geographies consisting of 43,492,822 people shows a significant negative correlation between the proportion of Soviet Union and percentage of population with a disability over the age of 75 in the United States with a correlation coefficient (R) of -0.684 and weighted average of 46.2%, a difference of 5.2%.
Disability Age Over 75 Correlation Summary
| Measurement | Iraqi | Soviet Union |
| Minimum | 23.1% | 17.4% |
| Maximum | 65.6% | 58.1% |
| Range | 42.5% | 40.7% |
| Mean | 47.8% | 42.4% |
| Median | 48.0% | 43.9% |
| Interquartile 25% (IQ1) | 44.8% | 37.9% |
| Interquartile 75% (IQ3) | 51.5% | 48.3% |
| Interquartile Range (IQR) | 6.8% | 10.4% |
| Standard Deviation (Sample) | 7.3% | 9.0% |
| Standard Deviation (Population) | 7.3% | 9.0% |
Similar Demographics by Disability Age Over 75
Demographics Similar to Iraqis by Disability Age Over 75
In terms of disability age over 75, the demographic groups most similar to Iraqis are West Indian (48.6%, a difference of 0.080%), Korean (48.6%, a difference of 0.10%), Immigrants from South Eastern Asia (48.7%, a difference of 0.20%), Sri Lankan (48.5%, a difference of 0.21%), and British West Indian (48.7%, a difference of 0.25%).
| Demographics | Rating | Rank | Disability Age Over 75 |
| French American Indians | 2.2 /100 | #242 | Tragic 48.3% |
| Immigrants | Caribbean | 2.1 /100 | #243 | Tragic 48.4% |
| Afghans | 1.8 /100 | #244 | Tragic 48.4% |
| Americans | 1.7 /100 | #245 | Tragic 48.4% |
| Chippewa | 1.6 /100 | #246 | Tragic 48.4% |
| Iroquois | 1.6 /100 | #247 | Tragic 48.4% |
| Sri Lankans | 1.4 /100 | #248 | Tragic 48.5% |
| Iraqis | 1.0 /100 | #249 | Tragic 48.6% |
| West Indians | 0.8 /100 | #250 | Tragic 48.6% |
| Koreans | 0.8 /100 | #251 | Tragic 48.6% |
| Immigrants | South Eastern Asia | 0.7 /100 | #252 | Tragic 48.7% |
| British West Indians | 0.6 /100 | #253 | Tragic 48.7% |
| Immigrants | Vietnam | 0.6 /100 | #254 | Tragic 48.7% |
| Chinese | 0.5 /100 | #255 | Tragic 48.7% |
| Immigrants | Congo | 0.5 /100 | #256 | Tragic 48.7% |
Demographics Similar to Soviet Union by Disability Age Over 75
In terms of disability age over 75, the demographic groups most similar to Soviet Union are Swiss (46.2%, a difference of 0.0%), New Zealander (46.2%, a difference of 0.0%), Immigrants from Latvia (46.2%, a difference of 0.020%), Argentinean (46.2%, a difference of 0.020%), and Immigrants from Western Europe (46.2%, a difference of 0.040%).
| Demographics | Rating | Rank | Disability Age Over 75 |
| Cambodians | 99.1 /100 | #73 | Exceptional 46.1% |
| Egyptians | 99.0 /100 | #74 | Exceptional 46.1% |
| Serbians | 99.0 /100 | #75 | Exceptional 46.1% |
| Slavs | 98.9 /100 | #76 | Exceptional 46.1% |
| Immigrants | Eastern Asia | 98.9 /100 | #77 | Exceptional 46.2% |
| Immigrants | Western Europe | 98.8 /100 | #78 | Exceptional 46.2% |
| Swiss | 98.8 /100 | #79 | Exceptional 46.2% |
| Soviet Union | 98.8 /100 | #80 | Exceptional 46.2% |
| New Zealanders | 98.8 /100 | #81 | Exceptional 46.2% |
| Immigrants | Latvia | 98.7 /100 | #82 | Exceptional 46.2% |
| Argentineans | 98.7 /100 | #83 | Exceptional 46.2% |
| Immigrants | Jordan | 98.7 /100 | #84 | Exceptional 46.2% |
| Immigrants | Southern Europe | 98.6 /100 | #85 | Exceptional 46.2% |
| Romanians | 98.6 /100 | #86 | Exceptional 46.2% |
| Danes | 98.6 /100 | #87 | Exceptional 46.2% |