Black/African American vs Soviet Union Seniors Poverty Over the Age of 75
COMPARE
Black/African American
Soviet Union
Seniors Poverty Over the Age of 75
Seniors Poverty Over the Age of 75 Comparison
Blacks/African Americans
Soviet Union
14.6%
SENIORS POVERTY OVER THE AGE OF 75
0.0/ 100
METRIC RATING
279th/ 347
METRIC RANK
14.5%
SENIORS POVERTY OVER THE AGE OF 75
0.0/ 100
METRIC RATING
276th/ 347
METRIC RANK
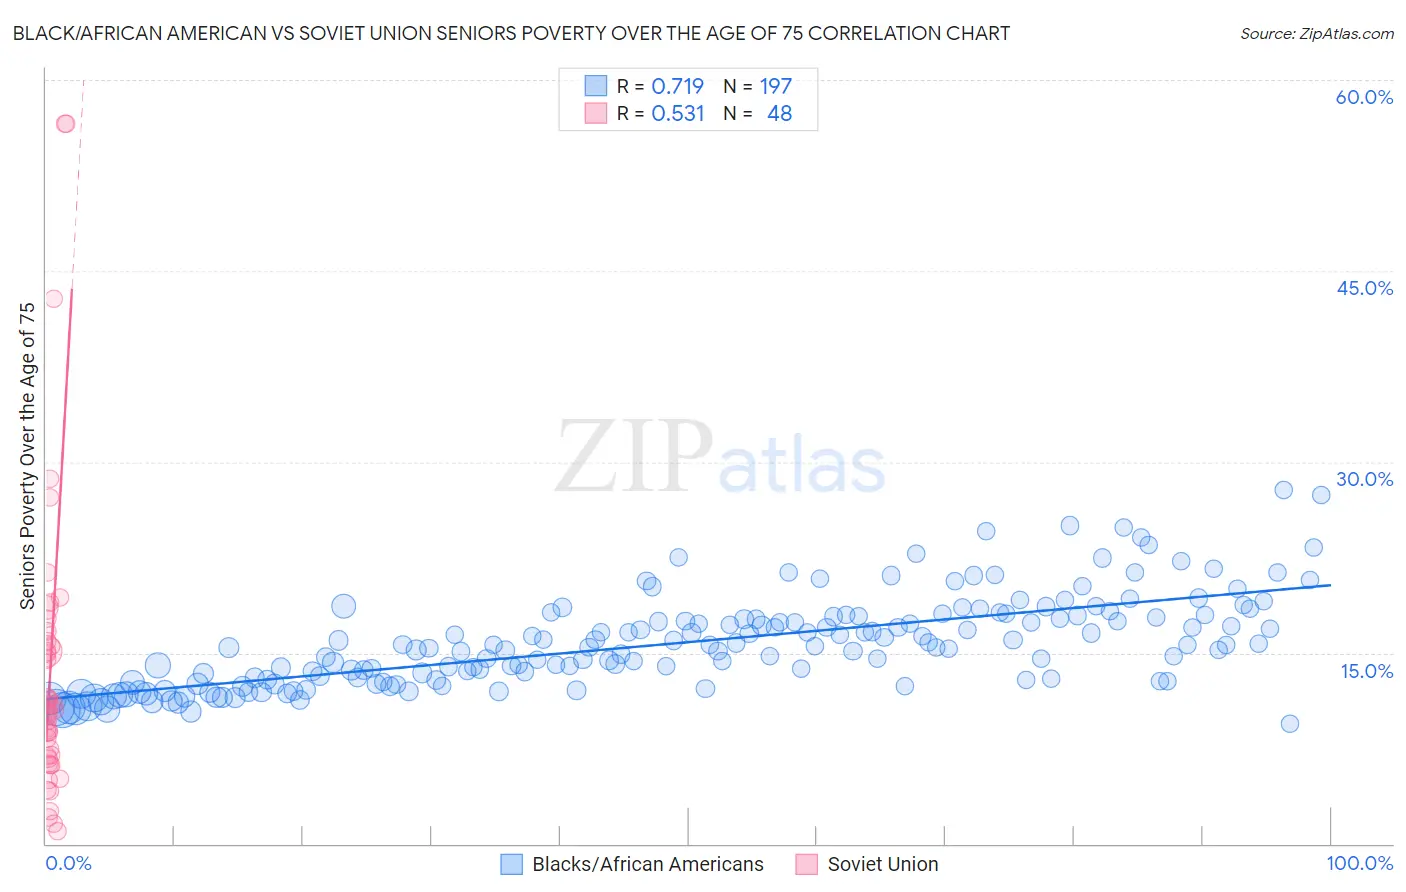
Black/African American vs Soviet Union Seniors Poverty Over the Age of 75 Correlation Chart
The statistical analysis conducted on geographies consisting of 551,157,628 people shows a strong positive correlation between the proportion of Blacks/African Americans and poverty level among seniors over the age of 75 in the United States with a correlation coefficient (R) of 0.719 and weighted average of 14.6%. Similarly, the statistical analysis conducted on geographies consisting of 43,442,527 people shows a substantial positive correlation between the proportion of Soviet Union and poverty level among seniors over the age of 75 in the United States with a correlation coefficient (R) of 0.531 and weighted average of 14.5%, a difference of 1.3%.
Seniors Poverty Over the Age of 75 Correlation Summary
| Measurement | Black/African American | Soviet Union |
| Minimum | 9.4% | 1.0% |
| Maximum | 27.7% | 56.5% |
| Range | 18.3% | 55.5% |
| Mean | 15.8% | 13.5% |
| Median | 15.4% | 10.5% |
| Interquartile 25% (IQ1) | 12.9% | 6.8% |
| Interquartile 75% (IQ3) | 17.8% | 15.7% |
| Interquartile Range (IQR) | 4.9% | 8.9% |
| Standard Deviation (Sample) | 3.5% | 11.8% |
| Standard Deviation (Population) | 3.5% | 11.7% |
Demographics Similar to Blacks/African Americans and Soviet Union by Seniors Poverty Over the Age of 75
In terms of seniors poverty over the age of 75, the demographic groups most similar to Blacks/African Americans are Immigrants from Colombia (14.6%, a difference of 0.21%), Central American (14.7%, a difference of 0.64%), Belizean (14.8%, a difference of 0.76%), Immigrants from Senegal (14.8%, a difference of 0.93%), and Senegalese (14.5%, a difference of 0.99%). Similarly, the demographic groups most similar to Soviet Union are Immigrants from El Salvador (14.5%, a difference of 0.050%), Immigrants from Bahamas (14.4%, a difference of 0.21%), Senegalese (14.5%, a difference of 0.27%), Immigrants from South America (14.4%, a difference of 0.38%), and Mexican (14.4%, a difference of 0.60%).
| Demographics | Rating | Rank | Seniors Poverty Over the Age of 75 |
| Venezuelans | 0.0 /100 | #267 | Tragic 14.2% |
| Colombians | 0.0 /100 | #268 | Tragic 14.3% |
| Immigrants | Venezuela | 0.0 /100 | #269 | Tragic 14.3% |
| Immigrants | Uruguay | 0.0 /100 | #270 | Tragic 14.3% |
| Immigrants | Ghana | 0.0 /100 | #271 | Tragic 14.4% |
| Mexicans | 0.0 /100 | #272 | Tragic 14.4% |
| Immigrants | South America | 0.0 /100 | #273 | Tragic 14.4% |
| Immigrants | Bahamas | 0.0 /100 | #274 | Tragic 14.4% |
| Immigrants | El Salvador | 0.0 /100 | #275 | Tragic 14.5% |
| Soviet Union | 0.0 /100 | #276 | Tragic 14.5% |
| Senegalese | 0.0 /100 | #277 | Tragic 14.5% |
| Immigrants | Colombia | 0.0 /100 | #278 | Tragic 14.6% |
| Blacks/African Americans | 0.0 /100 | #279 | Tragic 14.6% |
| Central Americans | 0.0 /100 | #280 | Tragic 14.7% |
| Belizeans | 0.0 /100 | #281 | Tragic 14.8% |
| Immigrants | Senegal | 0.0 /100 | #282 | Tragic 14.8% |
| Guatemalans | 0.0 /100 | #283 | Tragic 14.8% |
| Cheyenne | 0.0 /100 | #284 | Tragic 14.9% |
| Immigrants | Mexico | 0.0 /100 | #285 | Tragic 14.9% |
| Immigrants | Central America | 0.0 /100 | #286 | Tragic 15.0% |
| Immigrants | Guatemala | 0.0 /100 | #287 | Tragic 15.1% |